如何在 R 中绘制水平条形图
条形图是条形形式的数据表示,条形的高度表示值的数量。在本文中,我们将讨论如何用 R 编程语言绘制水平条形图。
R 语言支持两种绘制条形图的方法,我们将讨论如何修改它以供我们使用。
方法 1:使用barplot()
R 语言使用函数barplot()创建条形图。在这里,可以绘制垂直条和水平条。
Syntax: barplot(H, xlab, ylab, main, names.arg, col)
Parameters:
- H: This parameter is a vector or matrix containing numeric values which are used in bar chart.
- xlab: This parameter is the label for x axis in bar chart.
- ylab: This parameter is the label for y axis in bar chart.
- main: This parameter is the title of the bar chart.
- names.arg: This parameter is a vector of names appearing under each bar in bar chart.
- col: This parameter is used to give colors to the bars in the graph.
bar函数有一个名为“horiz”的字段,保持该字段值为“True”以水平创建条形图。
例子:
R
# Create example data
data <- data.frame(x_axis = (1:10),
                   y_axis = 9:0)

# barplot() function is used to
# plot the bar and horiz field is
# used to plot bar horizontally
barplot(data$x_axis ~ data$y_axis,
        horiz = TRUE)
R
# load the library
library("ggplot2")

# data frame created
data <- data.frame(x_axis = (1:10),
                   y_axis = 9:0)

# bar is created with the help of
# grom_bar() and ggplot() function
ggp <- ggplot(data, aes(x_axis, y_axis)) +
  geom_bar(stat = "identity")

# complete graph get flipped with the
# help of coord_flip() function
ggp +  coord_flip()
输出:
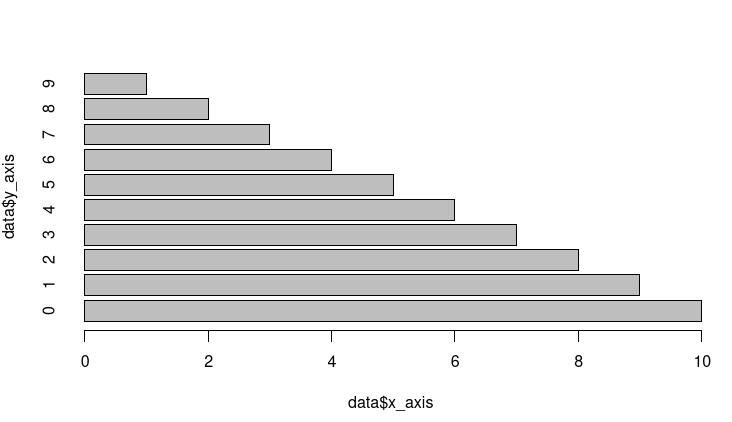
图 1:水平条形图
方法二:使用GGPLOT2
在此方法中,我们使用 ggplot2函数绘制条形图。 ggplot2 有一个名为 geom_bar() 的函数,用于绘制水平条,我们使用 ggplot() 将数据放入 geom_bar函数以绘制条。最后,我们将使用 coord_flip()函数翻转整个图。翻转的垂直图将生成水平图。
例子:
电阻
# load the library
library("ggplot2")

# data frame created
data <- data.frame(x_axis = (1:10),
                   y_axis = 9:0)

# bar is created with the help of
# grom_bar() and ggplot() function
ggp <- ggplot(data, aes(x_axis, y_axis)) +
  geom_bar(stat = "identity")

# complete graph get flipped with the
# help of coord_flip() function
ggp +  coord_flip()
输出:
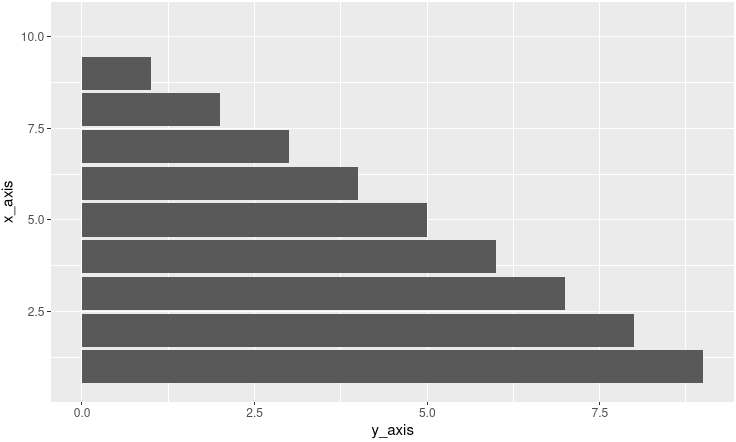
图 2:水平条形图