Matplotlib - 光标小部件
Matplotlib 是Python的数据可视化库。它由许多设计用于任何 GUI 后端的小部件组成。 matplotlib 中小部件的一些示例是 Button、CheckButtons、RadioButtons、Cursor 和 TextBox。本文讨论了 Matplotlib 库的 Cursor Widget。
光标水平和/或垂直跨越轴并随鼠标光标移动。
Syntax: Cursor(ax, horizOn=True, vertOn=True, useblit=False, **lineprops)
Parameters:
- ax : Axes to attach the cursor to.
- Optional Parameters:
- horizOn : To draw the horizontal line(default: True).
- vertOn : To draw the vertical line(default: True).
- useblit : Use blitting for faster drawing if supported by the backend(default: False).
- **lineprops: Line properties to control appearance of the lines(linewidth, color).
示例 1:
Python3
# importing cursor widget from matplotlib
from matplotlib.widgets import Cursor
import matplotlib.pyplot as plt
import numpy as np

fig = plt.figure()
ax = fig.add_axes([0.1, 0.1, 0.8, 0.8])

num = 100
x = np.random.rand(num)
y = np.random.rand(num)

ax.scatter(x, y, c='blue')
ax.set_xlabel('X-axis')
ax.set_ylabel('Y-axis')

cursor = Cursor(ax, color='green', linewidth=2)
plt.show()
Python3
# Import MultiCursor from matplotlib
from matplotlib.widgets import MultiCursor
import matplotlib.pyplot as plt
import numpy as np

fig, (ax1, ax2) = plt.subplots(nrows=2, sharex=True)

x = np.linspace(-np.pi, np.pi, 256, endpoint=True)
y = np.sin(x)
z = np.cos(x)

ax1.plot(x, y, label="sin function")
ax1.legend(loc="upper right")
ax2.plot(x, z, label="cos function")

multi = MultiCursor(fig.canvas, (ax1, ax2), color='g', lw=2,
                    horizOn=False, vertOn=True)

ax2.legend(loc="upper right")
plt.show()
Python3
from matplotlib.widgets import MultiCursor
import matplotlib.pyplot as plt
import numpy as np

fig, (ax1, ax2) = plt.subplots(1, 2, figsize=(12, 5))

x1 = ['Telugu', 'Hindi', 'English',
      'Maths', 'Science', 'Social']
y1 = [45, 34, 30, 45, 50, 38]
y2 = [36, 28, 30, 45, 38, 50]

labels = ["in 2020", "in 2021"]

l1 = ax1.plot(x1, y1, 'o', color="green")
l2 = ax2.plot(x1, y2, 'o', color="blue")

ax1.set_yticks(np.arange(0, 51, 5))
ax2.set_yticks(np.arange(0, 51, 5))

ax1.set_ylabel('Number of students passed', fontsize=15)

fig.legend([l1, l2], labels=labels, loc="upper right")
cursor = MultiCursor(fig.canvas, (ax1, ax2), color='r',
                     lw=2, horizOn=True, vertOn=True)

plt.subplots_adjust(right=0.9)
plt.show()
输出:

在上面的输出中,光标可以在整个 matplotlib 轴上水平和垂直移动。我们可以在需要的地方拖动光标。
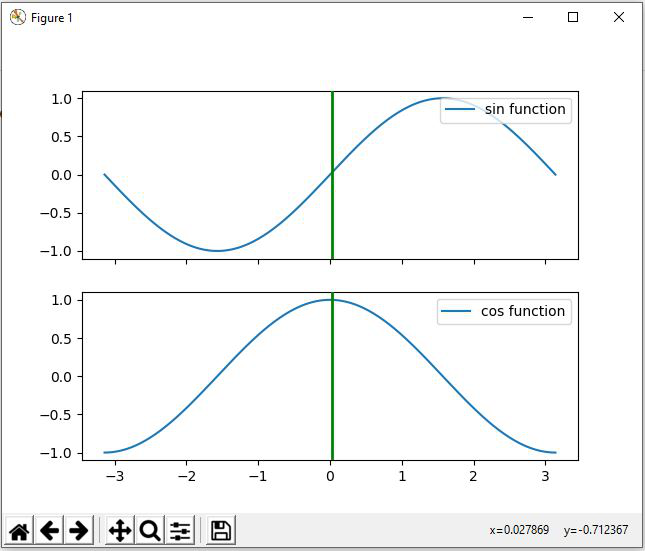
多光标
MultiCursor 用于同时在多个图上显示光标,即光标在多个轴之间共享。
Syntax:
MultiCursor(canvas, axes, useblit=True, horizOn=False, vertOn=True, **lineprops)
例子:
蟒蛇3
# Import MultiCursor from matplotlib
from matplotlib.widgets import MultiCursor
import matplotlib.pyplot as plt
import numpy as np

fig, (ax1, ax2) = plt.subplots(nrows=2, sharex=True)

x = np.linspace(-np.pi, np.pi, 256, endpoint=True)
y = np.sin(x)
z = np.cos(x)

ax1.plot(x, y, label="sin function")
ax1.legend(loc="upper right")
ax2.plot(x, z, label="cos function")

multi = MultiCursor(fig.canvas, (ax1, ax2), color='g', lw=2,
                    horizOn=False, vertOn=True)

ax2.legend(loc="upper right")
plt.show()
输出:
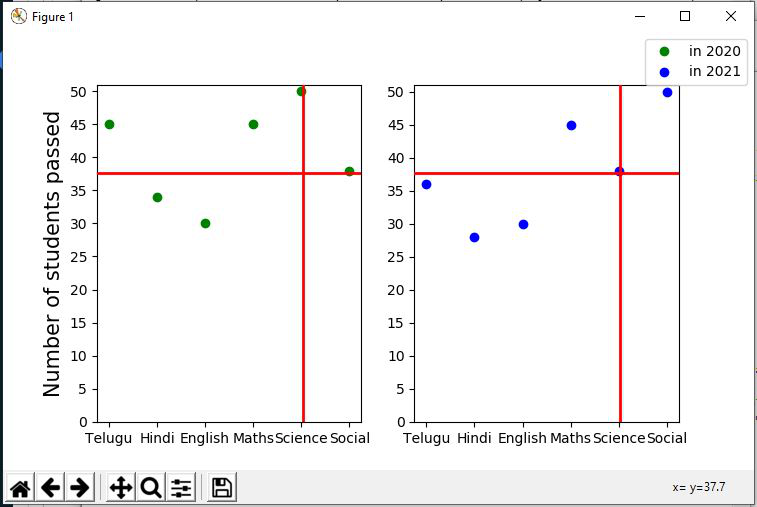
例子:
蟒蛇3
from matplotlib.widgets import MultiCursor
import matplotlib.pyplot as plt
import numpy as np

fig, (ax1, ax2) = plt.subplots(1, 2, figsize=(12, 5))

x1 = ['Telugu', 'Hindi', 'English',
      'Maths', 'Science', 'Social']
y1 = [45, 34, 30, 45, 50, 38]
y2 = [36, 28, 30, 45, 38, 50]

labels = ["in 2020", "in 2021"]

l1 = ax1.plot(x1, y1, 'o', color="green")
l2 = ax2.plot(x1, y2, 'o', color="blue")

ax1.set_yticks(np.arange(0, 51, 5))
ax2.set_yticks(np.arange(0, 51, 5))

ax1.set_ylabel('Number of students passed', fontsize=15)

fig.legend([l1, l2], labels=labels, loc="upper right")
cursor = MultiCursor(fig.canvas, (ax1, ax2), color='r',
                     lw=2, horizOn=True, vertOn=True)

plt.subplots_adjust(right=0.9)
plt.show()
输出: