Python Bokeh – 在图上绘制三角形
Bokeh 是一个Python交互式数据可视化。它使用 HTML 和 JavaScript 渲染其绘图。它针对现代 Web 浏览器进行演示,提供具有高性能交互性的新颖图形的优雅、简洁构造。
Bokeh 可用于在图形上绘制三角形。可以使用plotting模块的triangle()方法在图形上绘制三角形。
plotting.figure.triangle()
Syntax : triangle(parameters)
Parameters :
- x : x-coordinates of the center of the triangle markers
- y : y-coordinates of the center of the triangle markers
Returns : an object of class GlyphRenderer
示例 1:在此示例中,我们将使用默认值来绘制图形。
# importing the modules
from bokeh.plotting import figure, output_file, show

# file to save the model
output_file("gfg.html")

# instantiating the figure object
graph = figure(title = "Bokeh Triangle Graph")

# the points to be plotted
x = 0
y = 0

# plotting the graph
graph.triangle(x, y, size = 30)

# displaying the model
show(graph)
输出 : 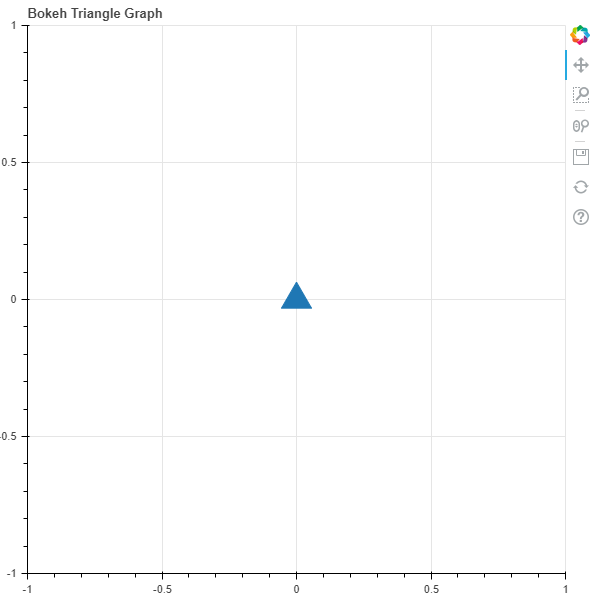
示例 2:在此示例中,我们将绘制具有各种其他参数的多个三角形。
# importing the modules
from bokeh.plotting import figure, output_file, show

# file to save the model
output_file("gfg.html")

# instantiating the figure object
graph = figure(title = "Bokeh Triangle Graph")

# name of the x-axis
graph.xaxis.axis_label = "x-axis"

# name of the y-axis
graph.yaxis.axis_label = "y-axis"

# points to be plotted
x = [3, 3, 5]
y = [3, 1, 3]
size = [130, 100, 60]

# color value of the triangles
color = ["yellow", "red", "purple"]

# fill alpha value of the triangles
fill_alpha = [0.9, 0.7, 0.5]

# plotting the graph
graph.triangle(x, y,
               size = size,
               color = color,
               fill_alpha = fill_alpha)

# displaying the model
show(graph)
输出 : 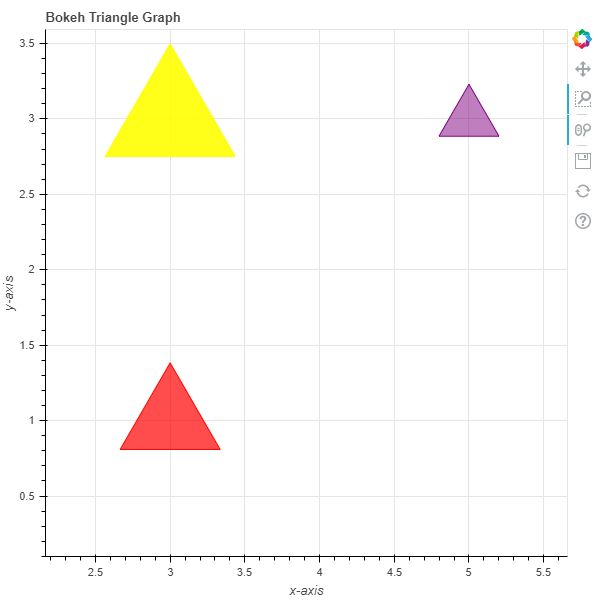
在评论中写代码?请使用 ide.geeksforgeeks.org,生成链接并在此处分享链接。