使用 Matplotlib 在Python中的误差线图
误差线函数用作图形增强功能,可在笛卡尔图上可视化绘制数据的可变性。可以将误差线应用于图表,以提供有关所呈现数据的额外细节层。如下图所示。
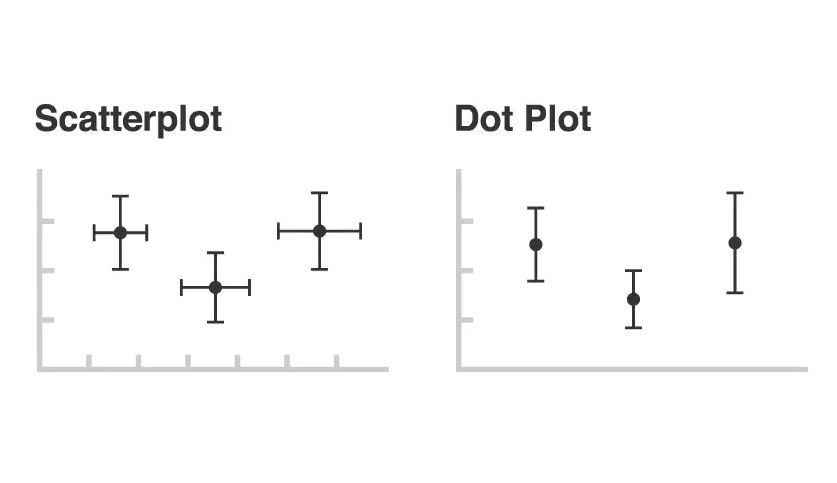
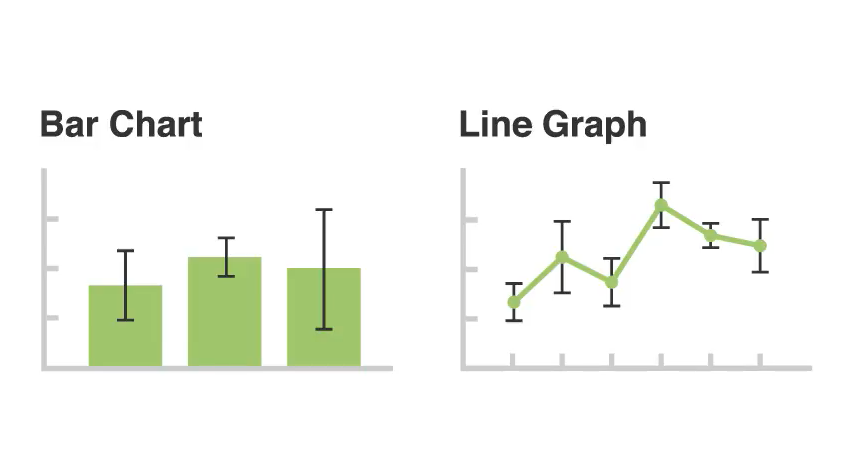
误差条可帮助您指示估计的误差或不确定性,以大致了解测量的精确度,这是通过使用在原始图形及其数据点上绘制的标记来完成的。为了可视化这些信息,误差条通过使用条形图从绘制的数据点或边缘的中心延伸的线来工作,误差条的长度有助于揭示数据点的不确定性,如下图所示。短误差条表示值集中表示绘制的平均值更有可能,而长误差条表示值更分散且不太可靠。也取决于数据的类型。每对误差线的长度往往在两边长度相等,但是,如果数据倾斜,那么每边的长度就会不平衡。

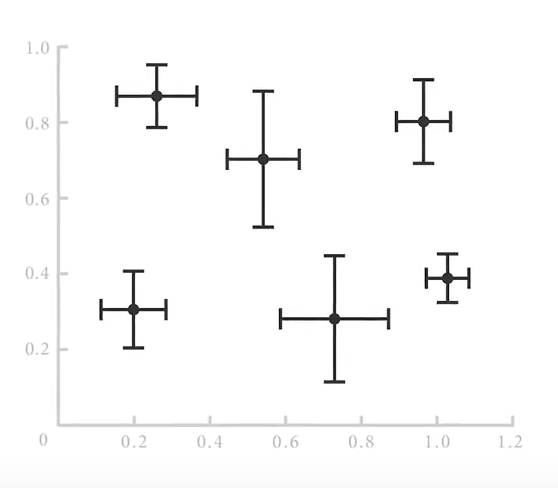
误差线始终平行于一定数量的刻度轴,因此它们可以垂直或水平显示,具体取决于定量刻度是在 y 轴上还是在 x 轴上,如果有两个刻度数量和两对箭头条可以用于两个轴。
让我们看一个错误栏的例子,它是如何工作的。
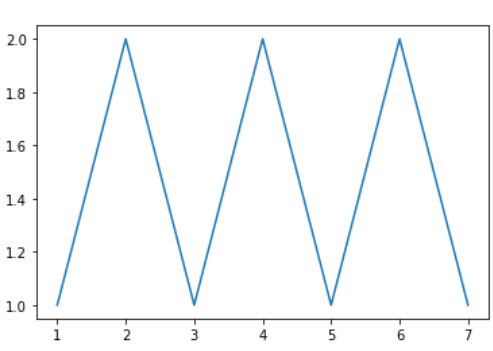
创建一个简单的图表。
Python3
# importing matplotlib
import matplotlib.pyplot as plt

# making a simple plot
x =[1, 2, 3, 4, 5, 6, 7]
y =[1, 2, 1, 2, 1, 2, 1]

# plotting graph
plt.plot(x, y)
Python3
# importing matplotlib
import matplotlib.pyplot as plt


# making a simple plot
x =[1, 2, 3, 4, 5, 6, 7]
y =[1, 2, 1, 2, 1, 2, 1]

# creating error
y_error = 0.2

# plotting graph
plt.plot(x, y)

plt.errorbar(x, y,
             yerr = y_error,
             fmt ='o')
Python3
# importing matplotlib
import matplotlib.pyplot as plt

# making a simple plot
x =[1, 2, 3, 4, 5, 6, 7]
y =[1, 2, 1, 2, 1, 2, 1]

# creating error
x_error = 0.5

# plotting graph
plt.plot(x, y)
plt.errorbar(x, y,
             xerr = x_error,
             fmt ='o')
Python3
# importing matplotlib
import matplotlib.pyplot as plt


# making a simple plot
x =[1, 2, 3, 4, 5, 6, 7]
y =[1, 2, 1, 2, 1, 2, 1]

# creating error
x_error = 0.5
y_error = 0.3

# plotting graph
plt.plot(x, y)
plt.errorbar(x, y,
             yerr = y_error,
             xerr = x_error,
             fmt ='o')
Python3
# importing matplotlib
import matplotlib.pyplot as plt


# making a simple plot
x =[1, 2, 3, 4, 5]
y =[1, 2, 1, 2, 1]

# creating error
y_errormin =[0.1, 0.5, 0.9,
             0.1, 0.9]
y_errormax =[0.2, 0.4, 0.6,
             0.4, 0.2]

x_error = 0.5
y_error =[y_errormin, y_errormax]

# plotting graph
# plt.plot(x, y)
plt.errorbar(x, y,
             yerr = y_error,
             xerr = x_error,
             fmt ='o')
Python3
# import require modules
import numpy as np
import matplotlib.pyplot as plt


# defining our function
x = np.arange(10)/10
y = (x + 0.1)**2

# defining our error
y_error = np.linspace(0.05, 0.2, 10)

# plotting our function and
# error bar
plt.plot(x, y)

plt.errorbar(x, y, yerr = y_error, fmt ='o')
输出:
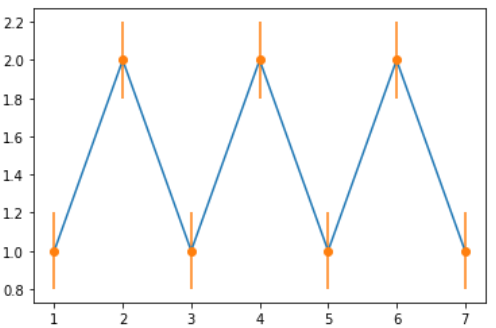
示例 1:在 y 值中添加一些错误。
Python3
# importing matplotlib
import matplotlib.pyplot as plt


# making a simple plot
x =[1, 2, 3, 4, 5, 6, 7]
y =[1, 2, 1, 2, 1, 2, 1]

# creating error
y_error = 0.2

# plotting graph
plt.plot(x, y)

plt.errorbar(x, y,
             yerr = y_error,
             fmt ='o')
输出:
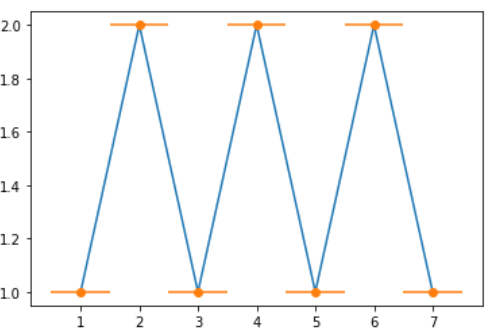
示例 2:在 x 值中添加一些错误。
Python3
# importing matplotlib
import matplotlib.pyplot as plt

# making a simple plot
x =[1, 2, 3, 4, 5, 6, 7]
y =[1, 2, 1, 2, 1, 2, 1]

# creating error
x_error = 0.5

# plotting graph
plt.plot(x, y)
plt.errorbar(x, y,
             xerr = x_error,
             fmt ='o')
输出:
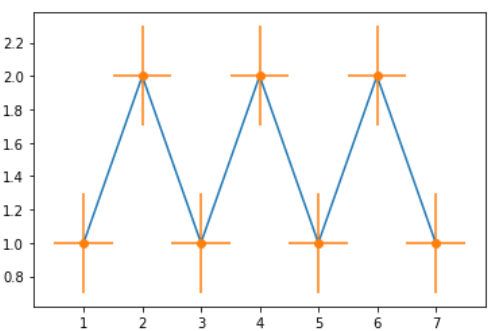
示例 3:在 x 和 y 中添加错误
Python3
# importing matplotlib
import matplotlib.pyplot as plt


# making a simple plot
x =[1, 2, 3, 4, 5, 6, 7]
y =[1, 2, 1, 2, 1, 2, 1]

# creating error
x_error = 0.5
y_error = 0.3

# plotting graph
plt.plot(x, y)
plt.errorbar(x, y,
             yerr = y_error,
             xerr = x_error,
             fmt ='o')
输出:
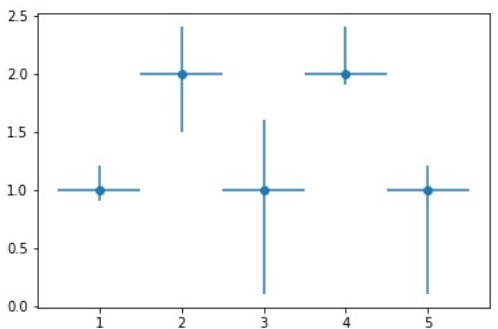
示例 4:在 x 和 y 中添加变量误差
Python3
# importing matplotlib
import matplotlib.pyplot as plt


# making a simple plot
x =[1, 2, 3, 4, 5]
y =[1, 2, 1, 2, 1]

# creating error
y_errormin =[0.1, 0.5, 0.9,
             0.1, 0.9]
y_errormax =[0.2, 0.4, 0.6,
             0.4, 0.2]

x_error = 0.5
y_error =[y_errormin, y_errormax]

# plotting graph
# plt.plot(x, y)
plt.errorbar(x, y,
             yerr = y_error,
             xerr = x_error,
             fmt ='o')
输出:
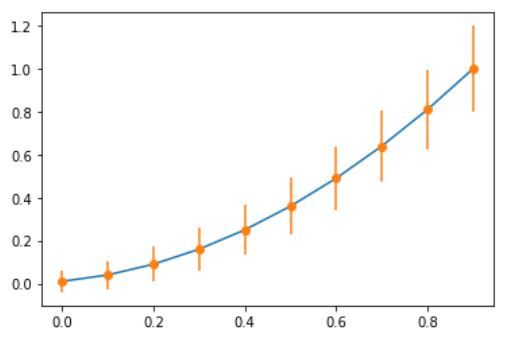
示例 5:
Python3
# import require modules
import numpy as np
import matplotlib.pyplot as plt


# defining our function
x = np.arange(10)/10
y = (x + 0.1)**2

# defining our error
y_error = np.linspace(0.05, 0.2, 10)

# plotting our function and
# error bar
plt.plot(x, y)

plt.errorbar(x, y, yerr = y_error, fmt ='o')
输出: