在Python中使用 Plotly 进行散点图
Plotly是一个Python库,用于设计图形,尤其是交互式图形。它可以绘制各种图形和图表,如直方图、条形图、箱线图、散布图等等。它主要用于数据分析和财务分析。 Plotly 是一个交互式可视化库。
散点图
散点图是一个图表,其中每个值都由点图表示。散点图需要相同长度的数组,一个用于 x 轴的值,另一个用于 y 轴的值。每个数据都表示为一个点,其位置由 x 和 y 列给出。它可以使用 plotly.express 的 scatter() 方法创建
Syntax: plotly.express.scatter(data_frame=None, x=None, y=None, color=None, symbol=None, size=None, hover_name=None, hover_data=None, custom_data=None, text=None, facet_row=None, facet_col=None, facet_col_wrap=0, error_x=None, error_x_minus=None, error_y=None, error_y_minus=None, animation_frame=None, animation_group=None, category_orders={}, labels={}, orientation=None, color_discrete_sequence=None, color_discrete_map={}, color_continuous_scale=None, range_color=None, color_continuous_midpoint=None, symbol_sequence=None, symbol_map={}, opacity=None, size_max=None, marginal_x=None, marginal_y=None, trendline=None, trendline_color_override=None, log_x=False, log_y=False, range_x=None, range_y=None, render_mode=’auto’, title=None, template=None, width=None, height=None)
参数: The marker color. Possible values: A single color format string. A sequence of color specifications of length n. A sequence of n numbers to be mapped to colors using cmap and norm. A 2-D array in which the rows are RGB or RGBAName Value Description x, y array_like, shape (n, ) The data positions s scalar or array_like, shape (n, ), optional The marker size in points**2. Default is rcParams[‘lines.markersize’] ** 2. c color, sequence, or sequence of color, optional marker MarkerStyle, optional The marker style. marker can be either an instance of the class or the text shorthand for a particular marker. Defaults to None, in which case it takes the value of rcParams[“scatter.marker”] = ‘o’ = ‘o’. See markers for more information about marker styles.
例子:
Python3
import plotly.express as px
import numpy as np
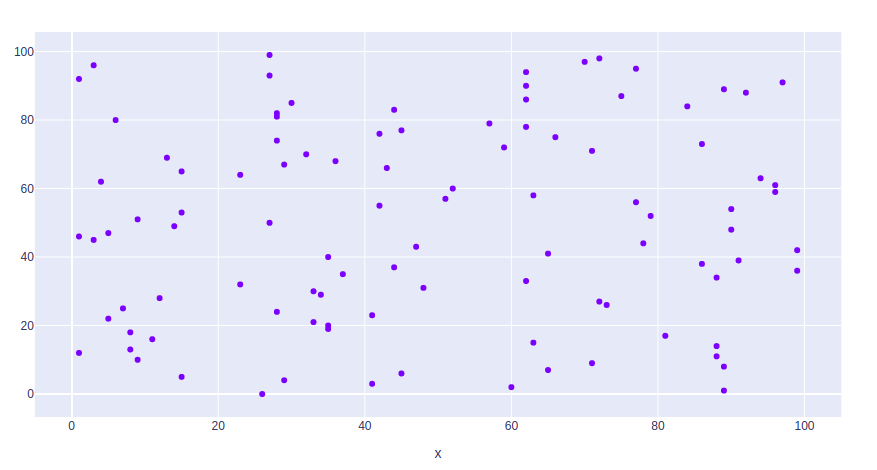
# creating random data through randomint
# function of numpy.random
np.random.seed(42)
random_x= np.random.randint(1,101,100)
random_y= np.random.randint(1,101,100)
plot = px.scatter(random_x, random_y)
plot.show()Python3
import plotly.express as px

# Loading the iris dataset
df = px.data.iris()

fig = px.scatter(df, x="sepal_width", y="sepal_length",
                 color="species")
fig.show()
Python3
import plotly.express as px

# Loading the iris dataset
df = px.data.iris()

fig = px.scatter(df, x="sepal_width", y="sepal_length",
                 color="species", size='petal_length',
                 hover_data=['petal_width'])
fig.show()
输出:
改变颜色
可以使用 scatter() 方法的颜色参数更改散点图的点颜色。
示例:我们将使用内置的 iris 数据集。
Python3
import plotly.express as px

# Loading the iris dataset
df = px.data.iris()

fig = px.scatter(df, x="sepal_width", y="sepal_length",
                 color="species")
fig.show()
输出:

改变大小
可以使用 scatter() 方法的 size 参数更改散点图的点的大小。
例子:
Python3
import plotly.express as px

# Loading the iris dataset
df = px.data.iris()

fig = px.scatter(df, x="sepal_width", y="sepal_length",
                 color="species", size='petal_length',
                 hover_data=['petal_width'])
fig.show()
输出:
