使用 Matplotlib 在Python中处理图像
Matplotlib是Python中用于数组二维图的惊人可视化库。 Matplotlib 是一个基于 NumPy 数组构建的多平台数据可视化库,旨在与更广泛的 SciPy 堆栈配合使用。
使用 Matplotlib 在Python中处理图像
matplotlib库中的image模块用于在Python中处理图像。 image模块还包括两个有用的方法,即用于读取图像的imread和用于显示图像的imshow 。
下面是一些示例,说明了使用matplotlib库对图像进行的各种操作:
示例 1:在此示例中,程序使用 matplotlib.image.imread() 读取图像并使用matplotlib.image.imread() matplotlib.image.imread()显示该图像。
# importing required libraries
import matplotlib.pyplot as plt
import matplotlib.image as img

# reading the image
testImage = img.imread('g4g.png')

# displaying the image
plt.imshow(testImage)
输出: 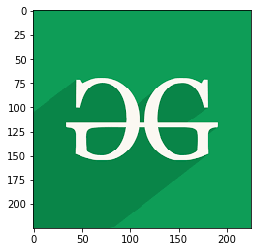
示例 2:下面的程序读取图像,然后将图像表示为数组。
# importing required libraries
import matplotlib.pyplot as plt
import matplotlib.image as img

# reading the image
testImage = img.imread('g4g.png')

# displaying the image as an array
print(testImage)
输出:
[[[0.05490196 0.6156863  0.34117648]
  [0.05490196 0.6156863  0.34117648]
  [0.05490196 0.6156863  0.34117648]
  ...
  [0.05490196 0.6156863  0.34117648]
  [0.05490196 0.6156863  0.34117648]
  [0.05490196 0.6156863  0.34117648]]

 [[0.05490196 0.6156863  0.34117648]
  [0.05490196 0.6156863  0.34117648]
  [0.05490196 0.6156863  0.34117648]
  ...
  [0.05490196 0.6156863  0.34117648]
  [0.05490196 0.6156863  0.34117648]
  [0.05490196 0.6156863  0.34117648]]

 [[0.05490196 0.6156863  0.34117648]
  [0.05490196 0.6156863  0.34117648]
  [0.05490196 0.6156863  0.34117648]
  ...
  [0.05490196 0.6156863  0.34117648]
  [0.05490196 0.6156863  0.34117648]
  [0.05490196 0.6156863  0.34117648]]

 ...

 [[0.03529412 0.52156866 0.28235295]
  [0.03529412 0.52156866 0.28235295]
  [0.03529412 0.52156866 0.28235295]
  ...
  [0.05490196 0.6156863  0.34117648]
  [0.05490196 0.6156863  0.34117648]
  [0.05490196 0.6156863  0.34117648]]

 [[0.03529412 0.52156866 0.28235295]
  [0.03529412 0.52156866 0.28235295]
  [0.03529412 0.52156866 0.28235295]
  ...
  [0.05490196 0.6156863  0.34117648]
  [0.05490196 0.6156863  0.34117648]
  [0.05490196 0.6156863  0.34117648]]

 [[0.03529412 0.52156866 0.28235295]
  [0.03529412 0.52156866 0.28235295]
  [0.03529412 0.52156866 0.28235295]
  ...
  [0.05490196 0.6156863  0.34117648]
  [0.05490196 0.6156863  0.34117648]
  [0.05490196 0.6156863  0.34117648]]]
示例 3:这里,图像的形状为(225, 225, 3) ,表示图像的(高度、宽度、模式),彩色图像模式值是从 0 到 2,黑白图像模式值是只有 0 和 1。在输出图像中,只修改了图像的模式。
# importing required libraries
import matplotlib.pyplot as plt
import matplotlib.image as img

# reading the image
testImage = img.imread('g4g.png')

# displaying the shape of the image
print(testImage.shape)

# modifying the shape of the image
modifiedImage = testImage[:, :, 0]

# displaying the modified image
plt.imshow(modifiedImage)
输出:
(225, 225, 3)
示例 4:在下面的程序中,图像形状的所有参数都被修改了。这里图像的高度为 150 像素(从第 50 个像素开始显示),宽度为 100 像素(从第 100 个像素开始显示),模式值为 1。
# importing required libraries
import matplotlib.pyplot as plt
import matplotlib.image as img

# reading the image
testImage = img.imread('g4g.png')

# displaying the shape of the image
print(testImage.shape)

# modifying the shape of the image
modifiedImage = testImage[50:200, 100:200, 1]

# displaying the modified image
plt.imshow(modifiedImage)
输出:
(225, 225, 3)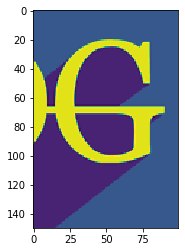
示例 5:这里没有修改任何参数。因此,将显示原始图像。
# importing required libraries
import matplotlib.pyplot as plt
import matplotlib.image as img

# reading the image
testImage = img.imread('g4g.png')

# displaying the shape of the image
print(testImage.shape)

# modifying the shape of the image
modifiedImage = testImage[:, :, :]

# displaying the modified image
plt.imshow(modifiedImage)
输出:
(225, 225, 3)