Python|使用 Matplotlib 处理 PNG 图像
Matplotlib 是Python中用于数组二维图的惊人可视化库。 Matplotlib 是一个基于 NumPy 数组构建的多平台数据可视化库,旨在与更广泛的 SciPy 堆栈配合使用。它是由 John Hunter 在 2002 年推出的。
可视化的最大好处之一是它允许我们以易于理解的视觉效果直观地访问大量数据。 Matplotlib 由几个图组成,如线、条、散点图、直方图等。
在本文中,我们将了解如何使用 Matplotlib 处理 PNG 图像。
代码 #1:使用 Matplotlib 读取 PNG 图像
# importing pyplot and image from matplotlib
import matplotlib.pyplot as plt
import matplotlib.image as img

# reading png image file
im = img.imread('imR.png')

# show image
plt.imshow(im)
输出: 
代码 #2:对图像应用伪色
伪彩色可用于增强图像的对比度。
# importing pyplot and image from matplotlib
import matplotlib.pyplot as plt
import matplotlib.image as img

# reading png image
im = img.imread('imR.png')

# applying pseudocolor
# default value of colormap is used.
lum = im[:, :, 0]

# show image
plt.imshow(lum)
输出: 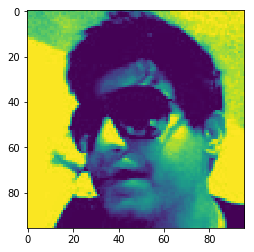
代码#3:我们可以使用颜色条为颜色图提供另一个值。
# importing pyplot and image from matplotlib
import matplotlib.pyplot as plt
import matplotlib.image as img

# reading png image
im = img.imread('imR.png')
lum = im[:, :, 0]

# setting colormap as hot
plt.imshow(lum, cmap ='hot')
plt.colorbar()
输出: 
插值方案:
插值计算像素“应该”的颜色或值,这在我们调整图像大小但想要相同信息时需要。调整图像大小时缺少空间,因为像素是离散的,而插值是填充该空间的方式。
代码#4:插值
# importing PIL and matplotlib
from PIL import Image
import matplotlib.pyplot as plt

# reading png image  file
img = Image.open('imR.png')

# resizing the image
img.thumbnail((50, 50), Image.ANTIALIAS)
imgplot = plt.imshow(img)
输出: 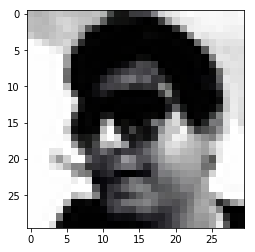
代码#6:这里,'bicubic' 值用于插值。
# importing pyplot from matplotlib
import matplotlib.pyplot as plt

# importing image from PIL
from PIL import Image

# reading image
img = Image.open('imR.png')

img.thumbnail((30, 30), Image.ANTIALIAS)

# bicubic used for interpolation
imgplot = plt.imshow(img, interpolation ='bicubic')
输出: 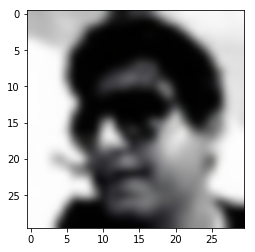
代码 #7: “sinc”值用于插值。
# importing PIL and matplotlib
from PIL import Image
import matplotlib.pyplot as plt

# reading image
img = Image.open('imR.png')

img.thumbnail((30, 30), Image.ANTIALIAS)

# sinc used for interpolation
imgplot = plt.imshow(img, interpolation ='sinc')
输出:  参考:https://matplotlib.org/gallery/images_contours_and_fields/interpolation_methods.html