在 Matplotlib 中绘制一条垂直线
Matplotlib 是一个流行的用于绘图的Python库,它提供了一个面向对象的 API 来渲染 GUI 绘图。绘制水平线相当简单,下面的代码展示了它是如何完成的。
制作一条垂直线
方法一:使用axvline ()
此函数添加跨越绘图轴的垂直线
Syntax: matplotlib.pyplot.axvline(x, color, xmin, xmax, linestyle)
Parameters:
- x: Position on X axis to plot the line, It accepts integers.
- xmin and xmax: scalar, optional, default: 0/1. It plots the line in the given range
- color: color for the line, It accepts a string. eg ‘r’ or ‘b’ .
- linestyle: Specifies the type of line, It accepts a string. eg ‘-‘, ‘–‘, ‘-.’, ‘:’, ‘None’, ‘ ‘, ”, ‘solid’, ‘dashed’, ‘dashdot’, ‘dotted’
Python3
# importing the modules
import matplotlib.pyplot as plt
import numpy as np

# specifying the plot size
plt.figure(figsize = (10, 5))

# only one line may be specified; full height
plt.axvline(x = 7, color = 'b', label = 'axvline - full height')

# rendering plot
plt.show()
Python3
# importing necessary libraries
import matplotlib.pyplot as plt
import numpy as np
# defining an array
xs = [1, 100]
# defining plot size
plt.figure(figsize = (10, 7))
# single line
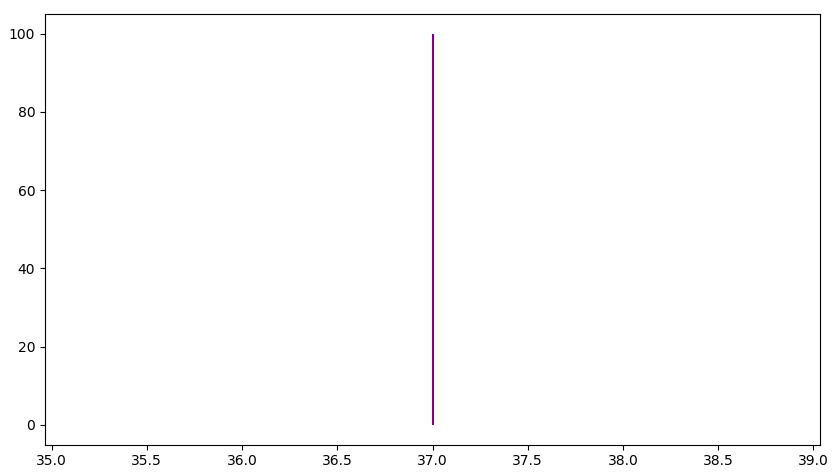
plt.vlines(x = 37, ymin = 0, ymax = max(xs),
colors = 'purple',
label = 'vline_multiple - full height')
plt.show()Python3
# importing library
import matplotlib.pyplot as plt

# defining plot size
plt.figure(figsize = (10, 5))

# specifying plot coordinates
plt.plot((0, 0), (0, 1), scaley = False)

# setting scaley = True will make the line fit
# withn the frame, i.e It will appear as a finite line
plt.show()
Python3
# importing the modules
import matplotlib.pyplot as plt
import numpy as np

# specifying the plot size
plt.figure(figsize = (10, 5))

# only one line may be specified; full height
plt.axvline(x = 7, color = 'b', label = 'axvline - full height')

# only one line may be specified; ymin & ymax specified as
# a percentage of y-range
plt.axvline(x = 7.25, ymin = 0.1, ymax = 0.90, color = 'r',
            label = 'axvline - % of full height')

# place legend outside
plt.legend(bbox_to_anchor = (1.0, 1), loc = 'upper left')

# rendering plot
plt.show()
Python3
# importing necessary libraries
import matplotlib.pyplot as plt
import numpy as np

# defining an array
xs = [1, 100]

# defining plot size
plt.figure(figsize = (10, 7))

# multiple lines all full height
plt.vlines(x = [37, 37.25, 37.5], ymin = 0, ymax = max(xs),
           colors = 'purple',
           label = 'vline_multiple - full height')

# multiple lines with varying ymin and ymax
plt.vlines(x = [38, 38.25, 38.5], ymin = [0, 25, 75], ymax = max(xs),
           colors = 'teal',
           label = 'vline_multiple - partial height')

# single vline with full ymin and ymax
plt.vlines(x = 39, ymin = 0, ymax = max(xs), colors = 'green',
           label = 'vline_single - full height')

# single vline with specific ymin and ymax
plt.vlines(x = 39.25, ymin = 25, ymax = max(xs), colors = 'green',
           label = 'vline_single - partial height')

# place legend outside
plt.legend(bbox_to_anchor = (1.0, 1), loc = 'up')
plt.show()
输出:

方法#2:使用vlines()
matplotlib.pyplot.vlines() 是用于绘制数据集的函数。在 matplotlib.pyplot.vlines() 中,vlines 是垂直线的缩写。这个函数的作用从扩展形式中非常清楚,它表示该函数处理跨轴的垂直线的绘制。
Syntax: vlines(x, ymin, ymax, colors, linestyles)
Parameters:
- x: Position on X axis to plot the line, It accepts integers.
- xmin and xmax: scalar, optional, default: 0/1. It plots the line in the given range
- color: color for the line, It accepts a string. eg ‘r’ or ‘b’ .
- linestyle: Specifies the type of line, It accepts a string. eg ‘-‘, ‘–‘, ‘-.’, ‘:’, ‘None’, ‘ ‘, ”, ‘solid’, ‘dashed’, ‘dashdot’, ‘dotted’
蟒蛇3
# importing necessary libraries
import matplotlib.pyplot as plt
import numpy as np

# defining an array
xs = [1, 100]

# defining plot size
plt.figure(figsize = (10, 7))

# single line
plt.vlines(x = 37, ymin = 0, ymax = max(xs),
           colors = 'purple',
           label = 'vline_multiple - full height')

plt.show()
输出:
方法 #3:使用plot()
matplotlib 库的 pyplot 模块中的 plot()函数用于制作点 x, y 的二维六边形分箱图。
Syntax : plot(x_points, y_points, scaley = False)
Parameters:
- x_points/y_points: points to plot
- scalex/scaley: Bool, These parameters determine if the view limits are adapted to the data limits
蟒蛇3
# importing library
import matplotlib.pyplot as plt

# defining plot size
plt.figure(figsize = (10, 5))

# specifying plot coordinates
plt.plot((0, 0), (0, 1), scaley = False)

# setting scaley = True will make the line fit
# withn the frame, i.e It will appear as a finite line
plt.show()
输出:

用图例绘制多条线
以下方法可用于在Python中绘制多条线。
方法一:使用axvline ()
蟒蛇3
# importing the modules
import matplotlib.pyplot as plt
import numpy as np

# specifying the plot size
plt.figure(figsize = (10, 5))

# only one line may be specified; full height
plt.axvline(x = 7, color = 'b', label = 'axvline - full height')

# only one line may be specified; ymin & ymax specified as
# a percentage of y-range
plt.axvline(x = 7.25, ymin = 0.1, ymax = 0.90, color = 'r',
            label = 'axvline - % of full height')

# place legend outside
plt.legend(bbox_to_anchor = (1.0, 1), loc = 'upper left')

# rendering plot
plt.show()
输出:

方法#2:使用vlines()
蟒蛇3
# importing necessary libraries
import matplotlib.pyplot as plt
import numpy as np

# defining an array
xs = [1, 100]

# defining plot size
plt.figure(figsize = (10, 7))

# multiple lines all full height
plt.vlines(x = [37, 37.25, 37.5], ymin = 0, ymax = max(xs),
           colors = 'purple',
           label = 'vline_multiple - full height')

# multiple lines with varying ymin and ymax
plt.vlines(x = [38, 38.25, 38.5], ymin = [0, 25, 75], ymax = max(xs),
           colors = 'teal',
           label = 'vline_multiple - partial height')

# single vline with full ymin and ymax
plt.vlines(x = 39, ymin = 0, ymax = max(xs), colors = 'green',
           label = 'vline_single - full height')

# single vline with specific ymin and ymax
plt.vlines(x = 39.25, ymin = 25, ymax = max(xs), colors = 'green',
           label = 'vline_single - partial height')

# place legend outside
plt.legend(bbox_to_anchor = (1.0, 1), loc = 'up')
plt.show()
输出:
