Python|时间序列预测的 ARIMA 模型
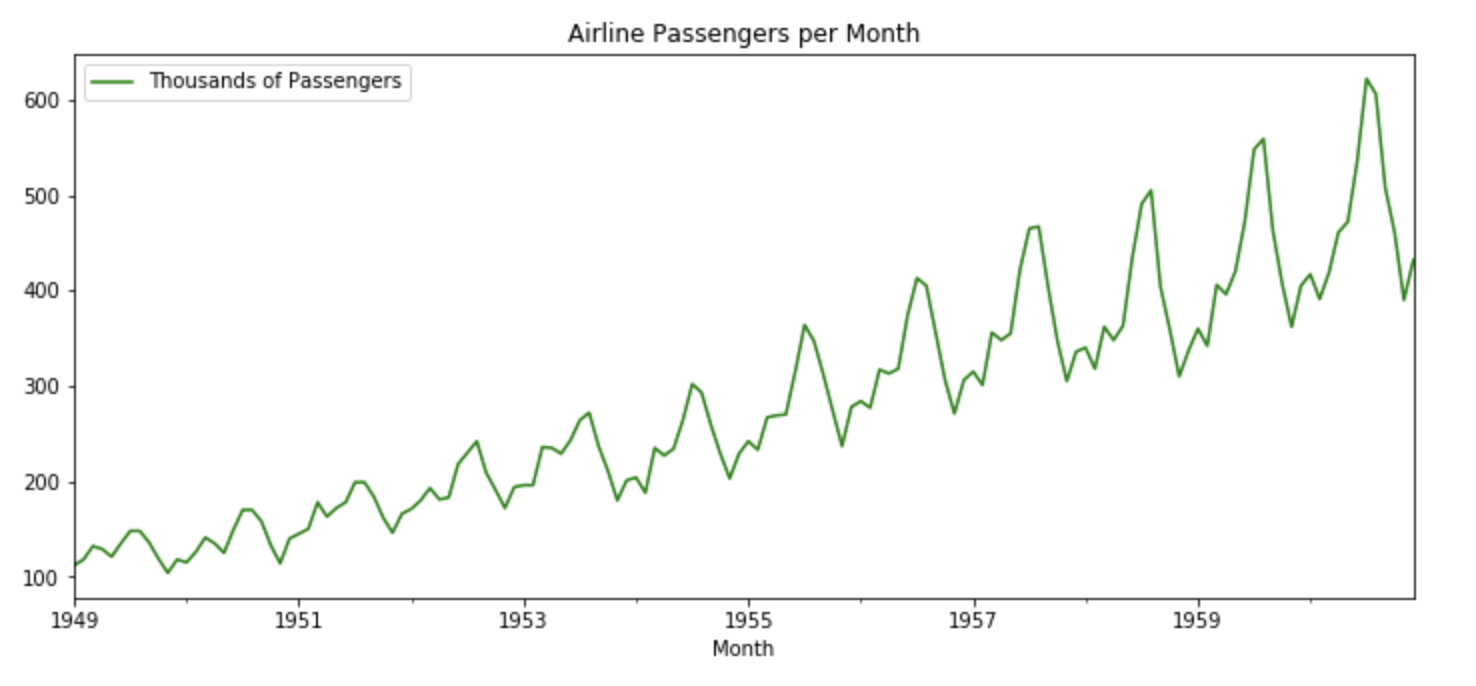
时间序列定义为按时间顺序索引的一系列数据点。时间顺序可以是每天、每月甚至每年。下面给出了一个时间序列示例,该示例说明了从 1949 年到 1960 年每月航空公司的乘客数量。
时间序列预测
时间序列预测是使用统计模型根据过去的结果预测时间序列的未来值的过程。
一些用例
时间序列的组成部分:
- 趋势:趋势显示了时间序列数据在很长一段时间内的大致方向。趋势可以是增加(向上)、减少(向下)或水平(静止)。
- 季节性:季节性成分表现出在时间、方向和幅度方面重复的趋势。一些例子包括夏季由于天气炎热导致用水量增加,或每年假期期间航空公司乘客数量增加。
- 周期性成分:这些是在特定时间段内没有固定重复的趋势。周期是指一个时间序列的起起落落、繁荣和萧条的时期,主要在商业周期中观察到。这些周期不表现出季节性变化,但通常发生在 3 到 12 年的时间段内,具体取决于时间序列的性质。
- 不规则变化:这些是时间序列数据中的波动,当趋势和周期性变化被移除时,这些波动变得明显。这些变化是不可预测的、不稳定的,并且可能是随机的,也可能不是随机的。
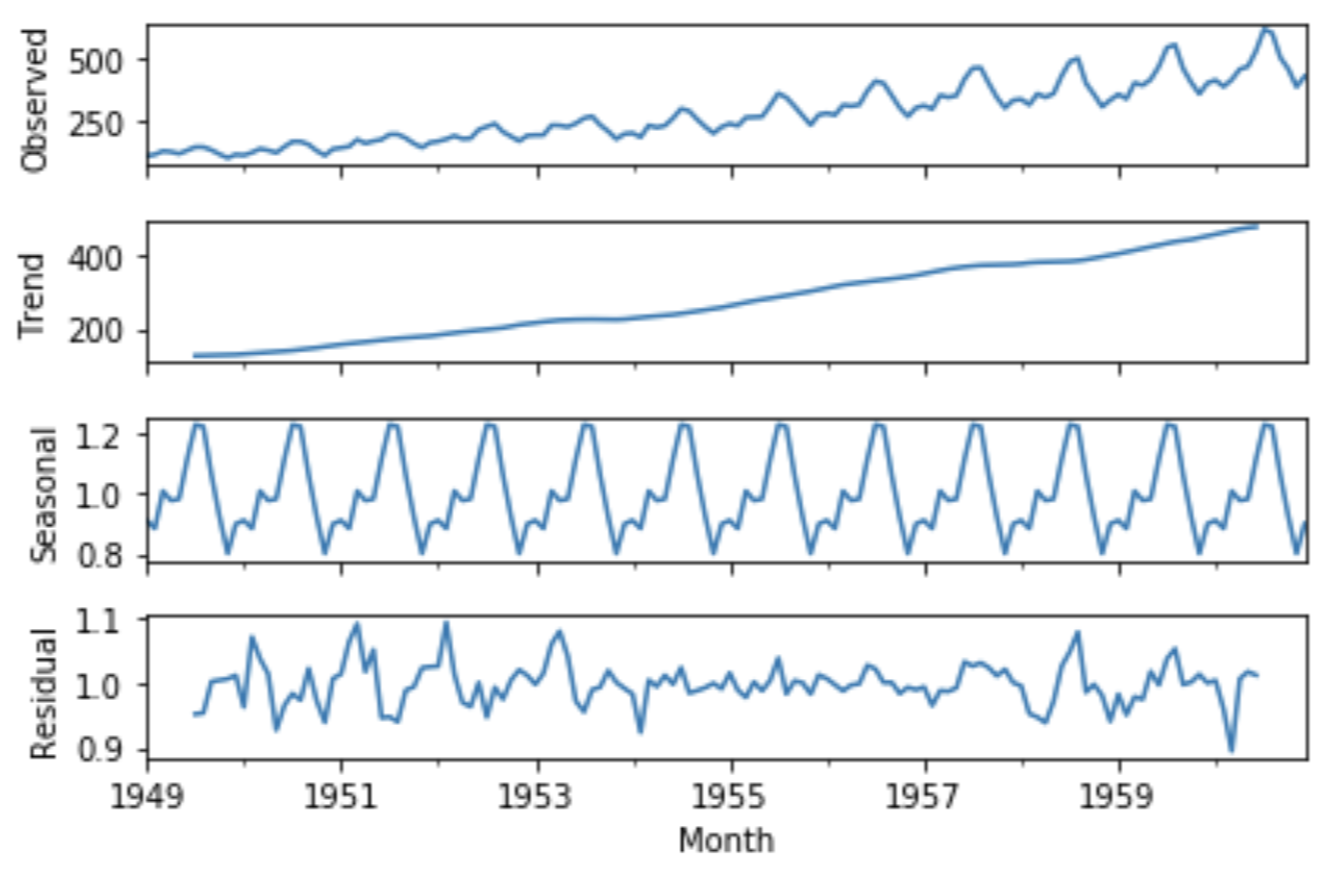
- ETS 分解
ETS 分解用于分离时间序列的不同组成部分。 ETS 一词代表错误、趋势和季节性。代码:航空公司乘客数据集的 ETS 分解:
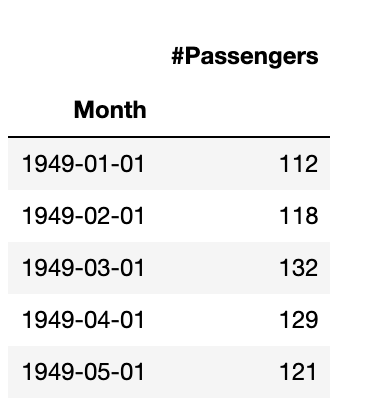
# Importing required libraries
import numpy as np
import pandas as pd
import matplotlib.pylot as plt
from statsmodels.tsa.seasonal import seasonal_decompose

# Read the AirPassengers dataset
airline = pd.read_csv('AirPassengers.csv',
                       index_col ='Month',
                       parse_dates = True)

# Print the first five rows of the dataset
airline.head()

# ETS Decomposition
result = seasonal_decompose(airline['# Passengers'],
                            model ='multiplicative')

# ETS plot
result.plot()
输出:
时间序列预测的 ARIMA 模型
ARIMA 代表自回归综合移动平均模型,由三个阶参数指定: (p, d, q)。 - AR( p ) 自回归– 一种回归模型,利用当前观测值与上一时期观测值之间的依赖关系。自回归 ( AR(p) ) 分量是指在时间序列的回归方程中使用过去值.
- I( d ) 积分- 使用观察差异(从前一个时间步的观察中减去观察)以使时间序列平稳。差分涉及将系列的当前值与其先前值 d 次相减。
- MA( q ) 移动平均- 一种模型,它使用观测值与应用于滞后观测值的移动平均模型的残差之间的依赖关系。移动平均分量将模型的误差描述为先前误差项的组合。顺序q表示要包含在模型中的项数。
ARIMA 模型的类型
- ARIMA:非季节性自回归综合移动平均线
- SARIMA:季节性 ARIMA
- SARIMAX:具有外生变量的季节性 ARIMA
Pyramid Auto-ARIMA
' pmdarima' 库中的 'auto_arima'函数可帮助我们识别 ARIMA 模型的最佳参数并返回拟合的 ARIMA 模型。
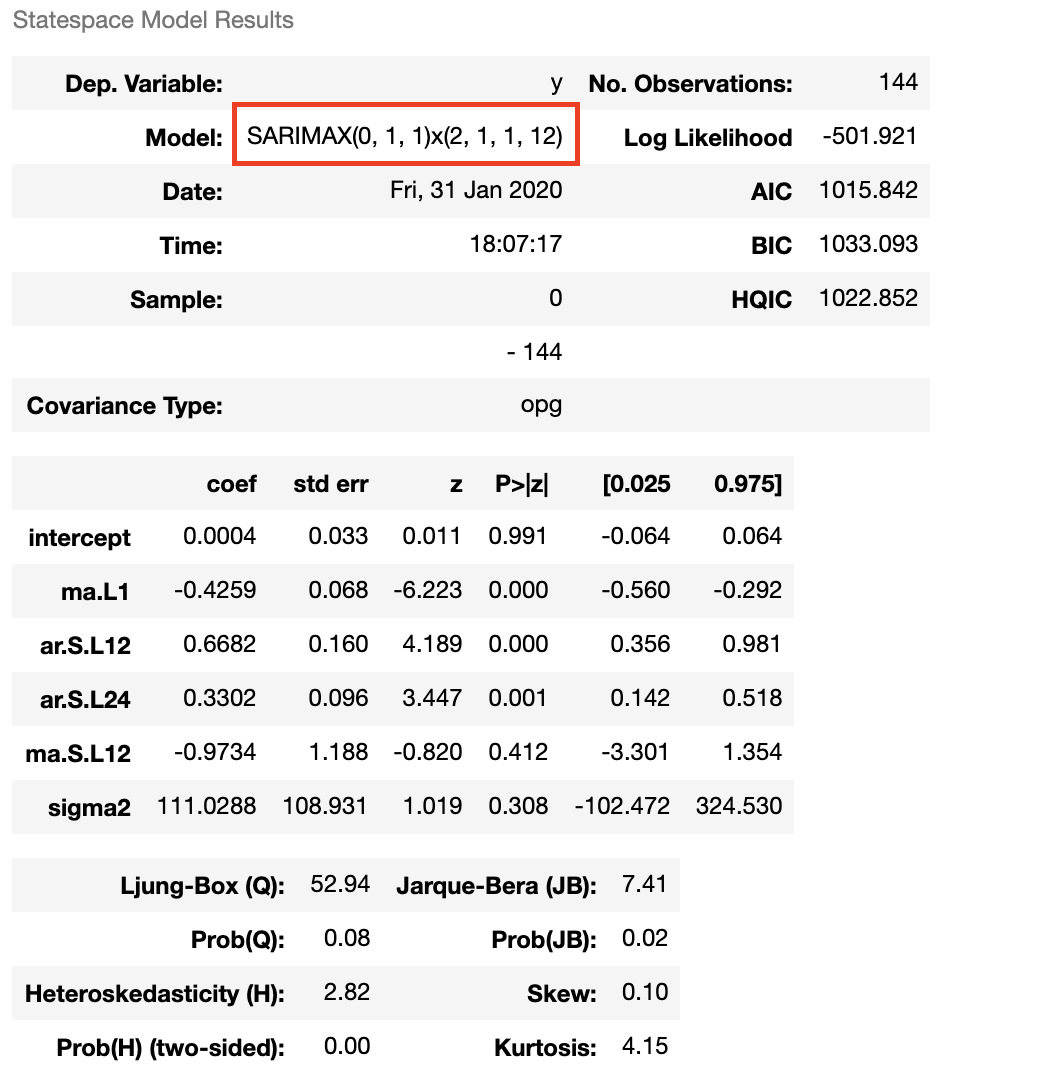
代码:ARIMA 模型的参数分析
# To install the library
pip install pmdarima

# Import the library
from pmdarima import auto_arima

# Ignore harmless warnings
import warnings
warnings.filterwarnings("ignore")

# Fit auto_arima function to AirPassengers dataset
stepwise_fit = auto_arima(airline['# Passengers'], start_p = 1, start_q = 1,
                          max_p = 3, max_q = 3, m = 12,
                          start_P = 0, seasonal = True,
                          d = None, D = 1, trace = True,
                          error_action ='ignore',   # we don't want to know if an order does not work
                          suppress_warnings = True,  # we don't want convergence warnings
                          stepwise = True)           # set to stepwise

# To print the summary
stepwise_fit.summary()
输出:
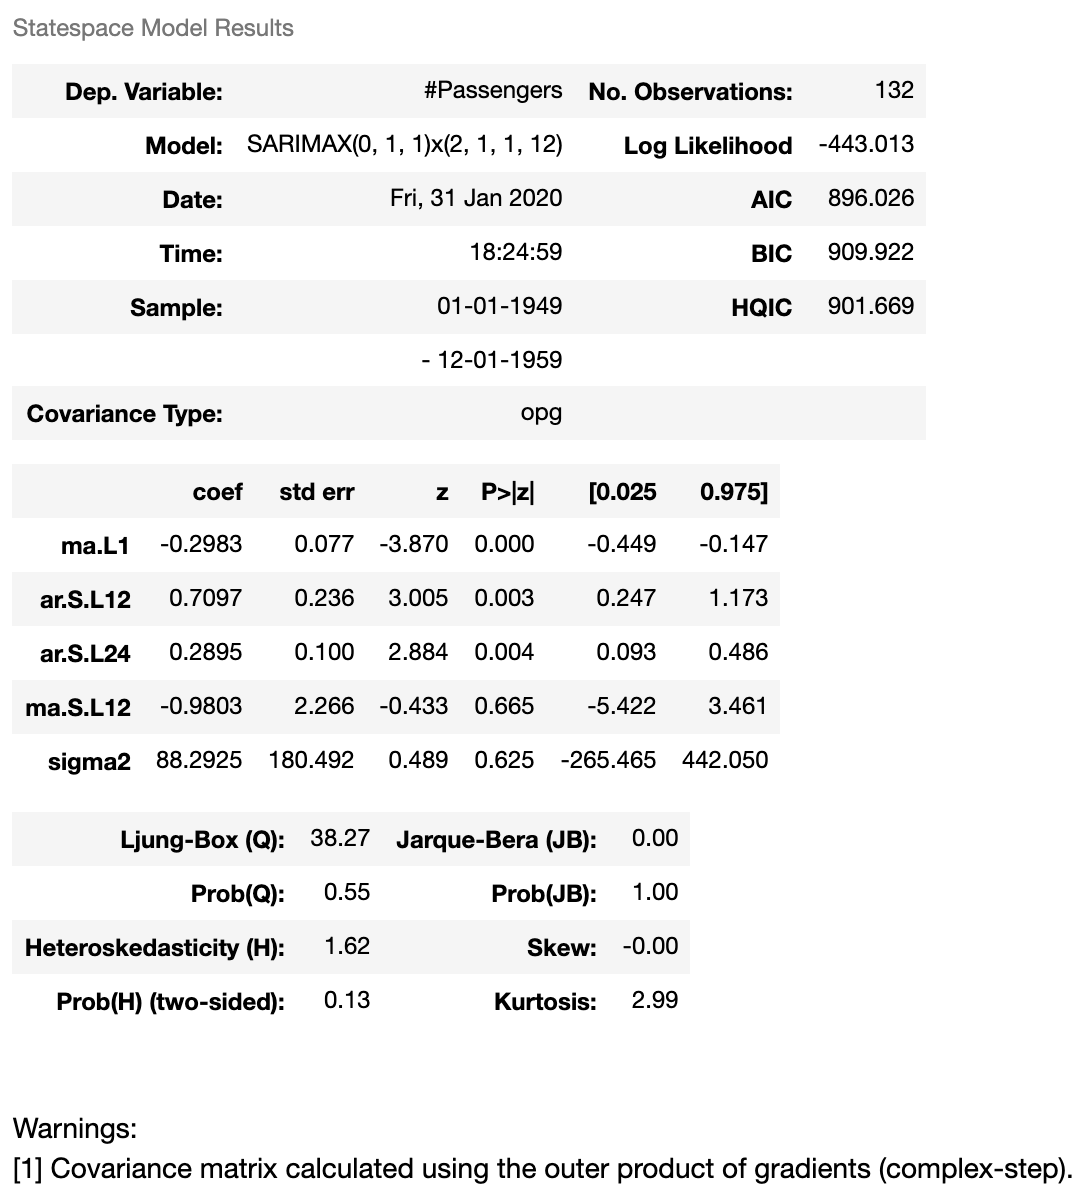
代码:将 ARIMA 模型拟合到 AirPassengers 数据集
# Split data into train / test sets
train = airline.iloc[:len(airline)-12]
test = airline.iloc[len(airline)-12:] # set one year(12 months) for testing

# Fit a SARIMAX(0, 1, 1)x(2, 1, 1, 12) on the training set
from statsmodels.tsa.statespace.sarimax import SARIMAX

model = SARIMAX(train['# Passengers'],
                order = (0, 1, 1),
                seasonal_order =(2, 1, 1, 12))

result = model.fit()
result.summary()
输出:
代码:ARIMA 模型对测试集的预测
start = len(train)
end = len(train) + len(test) - 1

# Predictions for one-year against the test set
predictions = result.predict(start, end,
                             typ = 'levels').rename("Predictions")

# plot predictions and actual values
predictions.plot(legend = True)
test['# Passengers'].plot(legend = True)
输出:

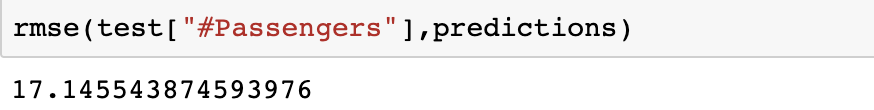
代码:使用 MSE 和 RMSE 评估模型
# Load specific evaluation tools
from sklearn.metrics import mean_squared_error
from statsmodels.tools.eval_measures import rmse

# Calculate root mean squared error
rmse(test["# Passengers"], predictions)

# Calculate mean squared error
mean_squared_error(test["# Passengers"], predictions)
输出:

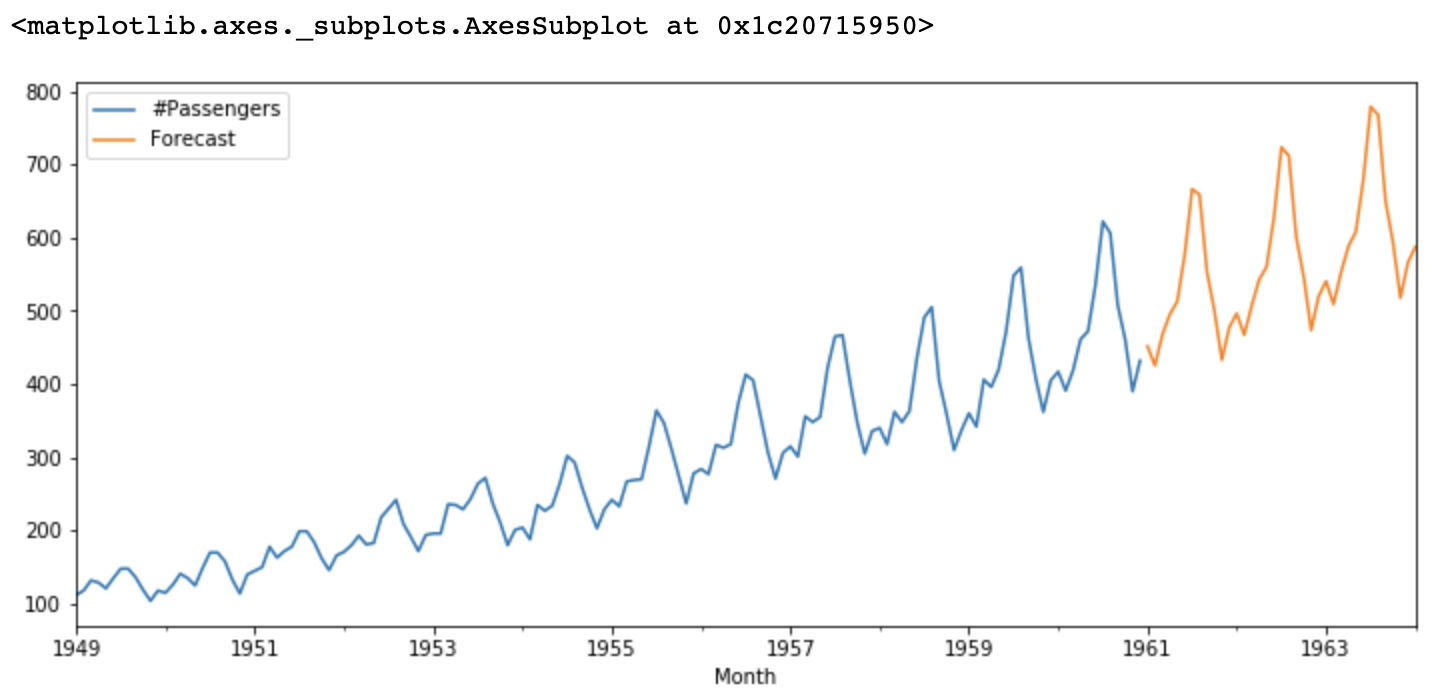
代码:使用 ARIMA 模型进行预测
# Train the model on the full dataset
model = model = SARIMAX(airline['# Passengers'],
                        order = (0, 1, 1),
                        seasonal_order =(2, 1, 1, 12))
result = model.fit()

# Forecast for the next 3 years
forecast = result.predict(start = len(airline),
                          end = (len(airline)-1) + 3 * 12,
                          typ = 'levels').rename('Forecast')

# Plot the forecast values
airline['# Passengers'].plot(figsize = (12, 5), legend = True)
forecast.plot(legend = True)
输出: