在Python中创建线性核 SVM
先决条件:支持向量机
让我们使用Python的 sklearn 库和可以在Python的数据集库中找到的Iris 数据集创建一个线性内核 SVM 。
当数据是线性可分时使用线性核,即可以使用单个 Line 将其分开。它是最常用的内核之一。它主要用于特定数据集中有大量特征的情况。有很多特征的例子之一是文本分类,因为每个字母表都是一个新特征。所以我们在文本分类中主要使用线性核。
注意:运行以下代码时,互联网连接必须稳定,因为它涉及下载数据。 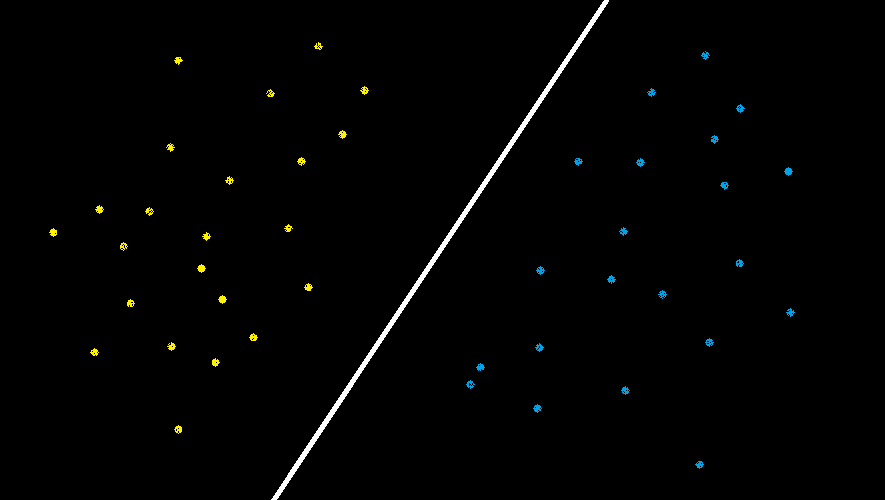
在上图中,有两组特征“蓝色”特征和“黄色”特征。由于这些可以很容易地分离,或者换句话说,它们是线性可分的,所以这里可以使用线性内核。
使用线性内核的优点:
1. 使用线性内核训练SVM比使用任何其他内核都快。
2. 用Linear Kernel训练SVM时,只需要优化C Regularization参数即可。另一方面,当使用其他内核进行训练时,需要优化γ参数,这意味着执行网格搜索通常会花费更多时间。
# Import the Libraries
import numpy as np
import matplotlib.pyplot as plt
from sklearn import svm, datasets

# Import some Data from the iris Data Set
iris = datasets.load_iris()

# Take only the first two features of Data.
# To avoid the slicing, Two-Dim Dataset can be used

X = iris.data[:, :2]
y = iris.target

# C is the SVM regularization parameter
C = 1.0

# Create an Instance of SVM and Fit out the data.
# Data is not scaled so as to be able to plot the support vectors
svc = svm.SVC(kernel ='linear', C = 1).fit(X, y)

# create a mesh to plot
x_min, x_max = X[:, 0].min() - 1, X[:, 0].max() + 1
y_min, y_max = X[:, 1].min() - 1, X[:, 1].max() + 1
h = (x_max / x_min)/100
xx, yy = np.meshgrid(np.arange(x_min, x_max, h),
         np.arange(y_min, y_max, h))

# Plot the data for Proper Visual Representation
plt.subplot(1, 1, 1)

# Predict the result by giving Data to the model
Z = svc.predict(np.c_[xx.ravel(), yy.ravel()])
Z = Z.reshape(xx.shape)
plt.contourf(xx, yy, Z, cmap = plt.cm.Paired, alpha = 0.8)

plt.scatter(X[:, 0], X[:, 1], c = y, cmap = plt.cm.Paired)
plt.xlabel('Sepal length')
plt.ylabel('Sepal width')
plt.xlim(xx.min(), xx.max())
plt.title('SVC with linear kernel')

# Output the Plot
plt.show()
输出: 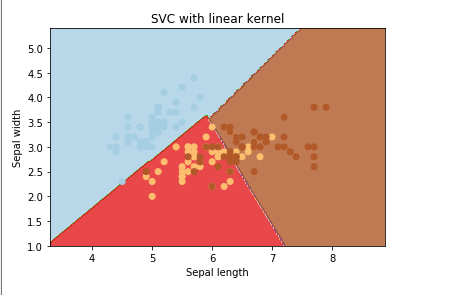
在这里,所有特征都使用简单的线条分隔,从而表示线性内核。