将多个新列添加到 R 中的 data.table
在本文中,我们将讨论如何在 R 编程语言中向 data.table 添加多个新列。为此,我们将首先安装 data.table 库,然后加载该库。
句法:
install.packages(“data.table”)
安装完所需的包后,下一步是创建表。我们在“data.table”的帮助下创建一个表并将该表存储在一个变量中。稍后,如果需求仍然存在,则可以通过首先将列创建为列表,然后通过以下方法之一将其添加到现有 data.table 来添加新列。
方法 1:使用 :=
可以使用:=运算符将列添加到现有数据表中。
句法:
‘:='(data type, constructors)
这里':'代表固定值,'='代表赋值。因此,它们一起代表固定值的分配。因此,在“:=”的帮助下,我们将在上表中添加 2 列。因此,首先我们将创建列并尝试将数据放入其中,我们将通过创建一个向量并将数据放入其中来完成此操作。
下面给出了支持这一点的各种示例。
例子:
R
# Create table using data.table
data <- data.table(x1 = 1:6,
                   x2 = 3:8)

y1 <- 10:15

y2 <- 4:9

# := is used to add columns in
# our table
data[ , `:=` (y1 = y1, y2 = y2)]

# print the data
data
R
# create the table
data <- data.table(x1 = 1:6,
                   x2 = 3:8)

# create the columns which we
# are going to be add in table
y1 <- 10:15
y2 <- 4:9

# add the columns with the help
# of ":=" into the table
data[, ':='(y1=y1,y2=y2)]

# create the data in column z1
# and z2 by multiplying x1,x2 for z1
# and by multiplying y1 and y2
# for z2 and add it to table by using ":="
data[, ':='(z1=x1*x2,z2=y1*y2)]

# print the table
data
R
# creating the table
data <- data.table(x1 = 1:6,
                   x2 = 3:8)

# creating the data of other
# columns
y1 <- 10:15
y2 <- 4:9

# add the above columns into
# the table
data[, ':='(y1=y1,y2=y2)]

# create extra column with the
# help of data in the table
data[, ':='(z1=x1*x2,z2=y1*y2)]

# create new columns by adding the
# column data of existing data
# add those created column to the
# table with the help of by function
data[, .(a1=x1+y1+z1,a2=x2+y2+z2),
     by=.(x1,x2,y1,y2,z1,z2)]
输出:
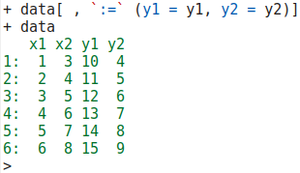
图 3:添加列后的表
我们还可以使用表中已经存在的数据在表中添加列。在使用冒号等号添加数据时,我们定义列的名称,即 z1 和 z2,然后在添加数据期间,我们将 z1 列中的“x1”和“x2”相乘,然后将“y1”和“y1”相乘'y2' 在 z2 列中,最后,我们打印表格。
例子:
电阻
# create the table
data <- data.table(x1 = 1:6,
                   x2 = 3:8)

# create the columns which we
# are going to be add in table
y1 <- 10:15
y2 <- 4:9

# add the columns with the help
# of ":=" into the table
data[, ':='(y1=y1,y2=y2)]

# create the data in column z1
# and z2 by multiplying x1,x2 for z1
# and by multiplying y1 and y2
# for z2 and add it to table by using ":="
data[, ':='(z1=x1*x2,z2=y1*y2)]

# print the table
data
输出:

图 6:添加 z1 和 z2 后的表
方法二:使用“.”和“通过”
在这种方法中,我们使用点“.”。与“通过”。这里 ”。”用于将数据放入新列中,而 by 用于将这些列添加到数据表中。因此,它们一起用于向表中添加列。
例子:
电阻
# creating the table
data <- data.table(x1 = 1:6,
                   x2 = 3:8)

# creating the data of other
# columns
y1 <- 10:15
y2 <- 4:9

# add the above columns into
# the table
data[, ':='(y1=y1,y2=y2)]

# create extra column with the
# help of data in the table
data[, ':='(z1=x1*x2,z2=y1*y2)]

# create new columns by adding the
# column data of existing data
# add those created column to the
# table with the help of by function
data[, .(a1=x1+y1+z1,a2=x2+y2+z2),
     by=.(x1,x2,y1,y2,z1,z2)]
输出:

图 7:添加 a1、a2 后的表格