Python Bokeh – 可视化 Iris 数据集
Bokeh 是一个Python交互式数据可视化。它使用 HTML 和 JavaScript 渲染其绘图。它针对现代 Web 浏览器进行演示,提供具有高性能交互性的新颖图形的优雅、简洁构造。
Bokeh 可用于可视化鸢尾花数据集。可视化是使用plotting模块完成的。在这里,我们将使用 Bokeh 提供给我们的 Iris 数据集。
下载数据集:
要下载 Iris 数据集,请在命令行上运行以下命令:
bokeh sampledata或者,我们也可以执行以下Python代码:
import bokeh
bokeh.sampledata.download()
分析数据集:
在 Bokeh 提供的样本数据中,有一个 iris.csv 文件,这是 Iris 数据集。下面是对 iris.csv 文件的一瞥:
sepal_length    sepal_width    petal_length    petal_width    species
5.1        3.5        1.4        0.2        setosa
4.9        3        1.4        0.2        setosa
4.7        3.2        1.3        0.2        setosa
4.6        3.1        1.5        0.2        setosa
5        3.6        1.4        0.2        setosa
数据集包含 5 个属性,它们是:
- 萼片长度(厘米)
- 萼片宽度以厘米为单位
- 花瓣长度(厘米)
- 花瓣宽度以厘米为单位
- 种有3种花种:
- 濑户
- 杂色
- 弗吉尼亚
每个物种有 50 条记录,总条目为 150 条。
可视化数据集:
我们将绘制图表以可视化所有 3 个物种的数据聚类。
示例 1:这里将绘制一个图形,其中花瓣的长度为 x 轴,花瓣的宽度为 y 轴。
- 导入所需的模块:
- 图、输出文件和显示来自 bokeh.plotting
- 来自 bokeh.sampledata.iris 的花朵
- 用标题实例化一个图形对象。
- 给 x 轴和 y 轴命名。
- 绘制所有 3 个物种的图表。
- 显示模型。
# importing the modules
from bokeh.sampledata.iris import flowers
from bokeh.plotting import figure, show, output_file

# file to save the model
output_file("gfg.html")

# instantiating the figure object
graph = figure(title = "Iris Visualization")

# labeling the x-axis and the y-axis
graph.xaxis.axis_label = "Petal Length (in cm)"
graph.yaxis.axis_label = "Petal Width (in cm)"

# plotting for setosa petals
x = flowers[flowers["species"] == "setosa"]["petal_length"]
y = flowers[flowers["species"] == "setosa"]["petal_width"]
color = "blue"
legend_label = "setosa petals"
graph.circle(x, y,
             color = color,
             legend_label = legend_label)

# plotting for versicolor petals
x = flowers[flowers["species"] == "versicolor"]["petal_length"]
y = flowers[flowers["species"] == "versicolor"]["petal_width"]
color = "yellow"
legend_label = "versicolor petals"
graph.circle(x, y,
             color = color,
             legend_label = legend_label)

# plotting for virginica petals
x = flowers[flowers["species"] == "virginica"]["petal_length"]
y = flowers[flowers["species"] == "virginica"]["petal_width"]
color = "red"
legend_label = "virginica petals"
graph.circle(x, y,
             color = color,
             legend_label = legend_label)

# relocating the legend table to
# avoid abstruction of the graph
graph.legend.location = "top_left"

# displaying the model
show(graph)
输出 : 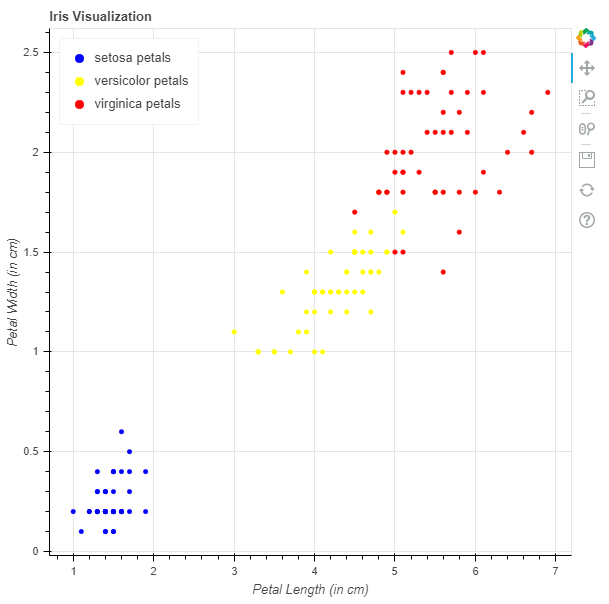
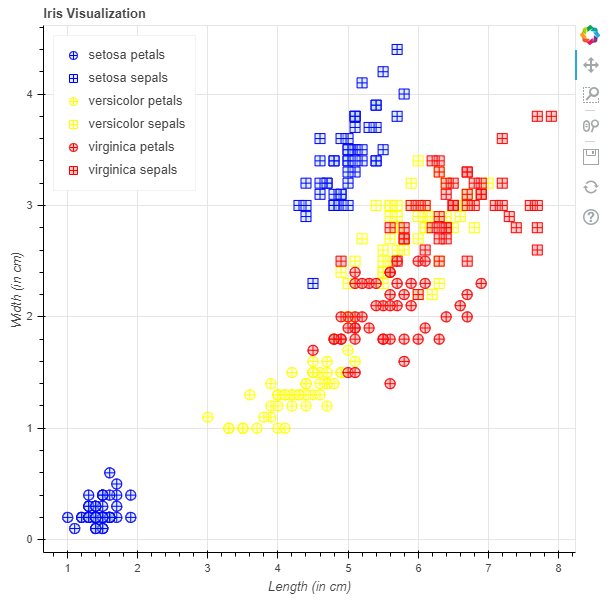
示例 2:这里将绘制一个散点图,其中包含萼片和花瓣,长度为 x 轴,宽度为 y 轴。
- 导入所需的模块:
- 图、输出文件和显示来自 bokeh.plotting
- 来自 bokeh.sampledata.iris 的花朵
- 用标题实例化一个图形对象。
- 给 x 轴和 y 轴命名。
- 绘制所有 3 个物种的图表。
- 显示模型。
# importing the modules
from bokeh.sampledata.iris import flowers
from bokeh.plotting import figure, show, output_file

# file to save the model
output_file("gfg.html")

# instantiating the figure object
graph = figure(title = "Iris Visualization")

# labeling the x-axis and the y-axis
graph.xaxis.axis_label = "Length (in cm)"
graph.yaxis.axis_label = "Width (in cm)"

# plotting for setosa petals
x = flowers[flowers["species"] == "setosa"]["petal_length"]
y = flowers[flowers["species"] == "setosa"]["petal_width"]
marker = "circle_cross"
line_color = "blue"
fill_color = "lightblue"
fill_alpha = 0.4
size = 10
legend_label = "setosa petals"
graph.scatter(x, y,
              marker = marker,
              line_color = line_color,
              fill_color = fill_color,
              fill_alpha = fill_alpha,
              size = size,
              legend_label = legend_label)

# plotting for setosa sepals
x = flowers[flowers["species"] == "setosa"]["sepal_length"]
y = flowers[flowers["species"] == "setosa"]["sepal_width"]
marker = "square_cross"
line_color = "blue"
fill_color = "lightblue"
fill_alpha = 0.4
size = 10
legend_label = "setosa sepals"
graph.scatter(x, y,
              marker = marker,
              line_color = line_color,
              fill_color = fill_color,
              fill_alpha = fill_alpha,
              size = size,
              legend_label = legend_label)

# plotting for versicolor petals
x = flowers[flowers["species"] == "versicolor"]["petal_length"]
y = flowers[flowers["species"] == "versicolor"]["petal_width"]
marker = "circle_cross"
line_color = "yellow"
fill_color = "lightyellow"
fill_alpha = 0.4
size = 10
legend_label = "versicolor petals"
graph.scatter(x, y,
              marker = marker,
              line_color = line_color,
              fill_color = fill_color,
              fill_alpha = fill_alpha,
              size = size,
              legend_label = legend_label)

# plotting for versicolor sepals
x = flowers[flowers["species"] == "versicolor"]["sepal_length"]
y = flowers[flowers["species"] == "versicolor"]["sepal_width"]
marker = "square_cross"
line_color = "yellow"
fill_color = "lightyellow"
fill_alpha = 0.4
size = 10
legend_label = "versicolor sepals"
graph.scatter(x, y,
              marker = marker,
              line_color = line_color,
              fill_color = fill_color,
              fill_alpha = fill_alpha,
              size = size,
              legend_label = legend_label)

# plotting for virginica petals
x = flowers[flowers["species"] == "virginica"]["petal_length"]
y = flowers[flowers["species"] == "virginica"]["petal_width"]
marker = "circle_cross"
line_color = "red"
fill_color = "lightcoral"
fill_alpha = 0.4
size = 10
legend_label = "virginica petals"
graph.scatter(x, y,
              marker = marker,
              line_color = line_color,
              fill_color = fill_color,
              fill_alpha = fill_alpha,
              size = size,
              legend_label = legend_label)

# plotting for virginica sepals
x = flowers[flowers["species"] == "virginica"]["sepal_length"]
y = flowers[flowers["species"] == "virginica"]["sepal_width"]
marker = "square_cross"
line_color = "red"
fill_color = "lightcoral"
fill_alpha = 0.4
size = 10
legend_label = "virginica sepals"
graph.scatter(x, y,
              marker = marker,
              line_color = line_color,
              fill_color = fill_color,
              fill_alpha = fill_alpha,
              size = size,
              legend_label = legend_label)

# relocating the legend table to
# avoid abstruction of the graph
graph.legend.location = "top_left"

# displaying the model
show(graph)
输出 :