鸢尾花数据的箱线图和直方图探索
关于数据集的属性信息:
Attribute Information:
   -> sepal length in cm
   -> sepal width in cm
   -> petal length in cm
   -> petal width in cm
   -> class:
              Iris Setosa
              Iris Versicolour
              Iris Virginica

Number of Instances: 150

Summary Statistics:
             Min  Max   Mean    SD   Class Correlation
   sepal length: 4.3  7.9   5.84  0.83    0.7826
    sepal width: 2.0  4.4   3.05  0.43   -0.4194
   petal length: 1.0  6.9   3.76  1.76    0.9490  (high!)
    petal width: 0.1  2.5   1.20  0.76    0.9565  (high!)

Class Distribution: 33.3% for each of 3 classes.
要获取虹膜数据,请单击此处。
加载库
import numpy as np
import pandas as pd
import matplotlib.pyplot as plt
加载数据中
data = pd.read_csv("Iris.csv")

print (data.head(10))
输出: 
描述
data.describe()
输出: 
信息
data.info()
输出:  代码#1:萼片长度直方图
plt.figure(figsize = (10, 7))
x = data["SepalLengthCm"]

plt.hist(x, bins = 20, color = "green")
plt.title("Sepal Length in cm")
plt.xlabel("Sepal_Length_cm")
plt.ylabel("Count")
输出: 
代码#2:萼片宽度直方图
plt.figure(figsize = (10, 7))
x = data.SepalWidthCm

plt.hist(x, bins = 20, color = "green")
plt.title("Sepal Width in cm")
plt.xlabel("Sepal_Width_cm")
plt.ylabel("Count")

plt.show()
输出: 
代码#3:花瓣长度直方图
plt.figure(figsize = (10, 7))
x = data.PetalLengthCm

plt.hist(x, bins = 20, color = "green")
plt.title("Petal Length in cm")
plt.xlabel("Petal_Length_cm")
plt.ylabel("Count")

plt.show()
输出: 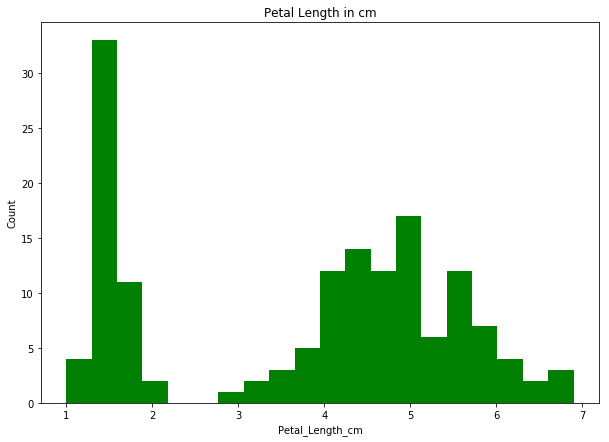
代码#4:花瓣宽度直方图
plt.figure(figsize = (10, 7))
x = data.PetalWidthCm

plt.hist(x, bins = 20, color = "green")
plt.title("Petal Width in cm")
plt.xlabel("Petal_Width_cm")
plt.ylabel("Count")

plt.show()
输出: 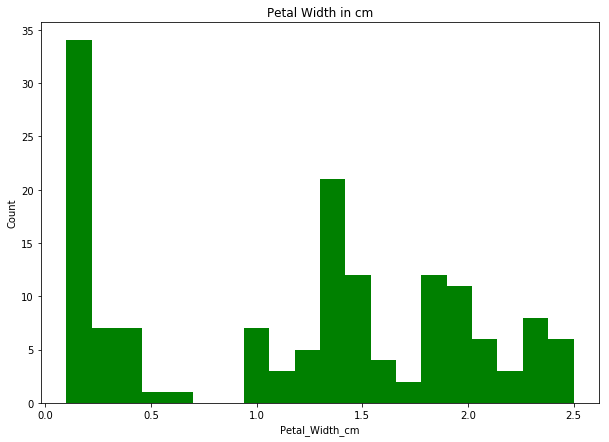
代码 #5:箱线图的数据准备
# removing Id column
new_data = data[["SepalLengthCm", "SepalWidthCm", "PetalLengthCm", "PetalWidthCm"]]
print(new_data.head())
输出 : 
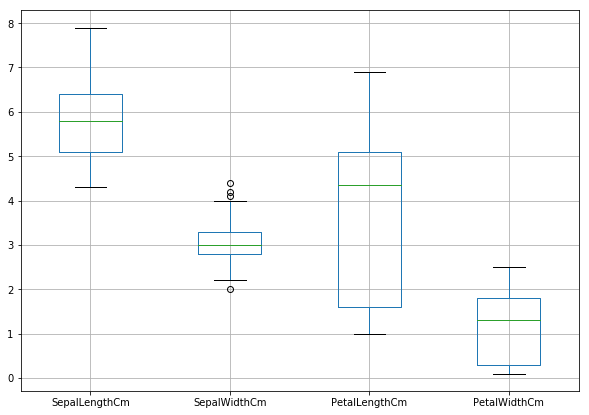
代码 #6:虹膜数据的箱线图
plt.figure(figsize = (10, 7))
new_data.boxplot()
输出 :