使用 Matplotlib 在Python中制作小提琴图
Matplotlib是一个绘图库,用于在Python中创建静态、动画和交互式可视化。 Matplotlib 可用于Python脚本、 Python和 IPython shell、Web 应用程序服务器以及各种图形用户界面工具包,如 Tkinter、awxPython 等。
注意:有关更多信息,请参阅Python Matplotlib - 概述
小提琴情节意味着什么?
小提琴图是箱线图和直方图的组合。它描绘了数据的分布、中位数、四分位数范围。所以我们看到 iqr 和中位数是由箱线图提供的统计信息,而分布是由直方图提供的。
小提琴剧情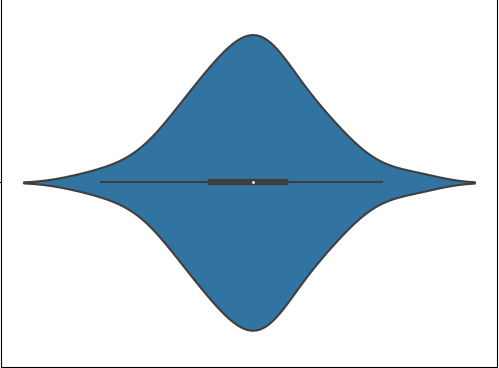
- 白点是指中位数。
- 粗线的端点代表 iqr1 和 iqr3。
- 细线的端点代表类似于箱线图的最小值和最大值。
- 高于 1.5x 四分位数(细线的最小、最大端点)的分布表示存在异常值。
Syntax: violinplot(dataset, positions=None, vert=True, widths=0.5, showmeans=False, showextrema=True, showmedians=False, quantiles=None, points=100,
bw_method=None, *, data=None)
Parameters:
dataset: Array or a sequence of vectors.
The input data.
positions: array-like, default = [1, 2, …, n].
Sets the positions of the violins. The ticks and limits are automatically set to match the positions.
vert: bool, default = True.
If true, creates a vertical violin plot. Otherwise, creates a horizontal violin plot.
widths: array-like, default = 0.5
Either a scalar or a vector that sets the maximal width of each violin. The default is 0.5, which uses about half of the available horizontal space.
showmeans: bool, default = False
If True, will toggle rendering of the means.
showextrema: bool, default = True
If True, will toggle rendering of the extrema.
showmedians: bool, default = False
If True, will toggle rendering of the medians.
quantiles: array-like, default = None
If not None, set a list of floats in interval [0, 1] for each violin, which stands for the quantiles that will be rendered for that violin.
points: scalar, default = 100
Defines the number of points to evaluate each of the gaussian kernel density estimations at.
bw_method: str, scalar or callable, optional
The method used to calculate the estimator bandwidth. This can be ‘scott’, ‘silverman’, a scalar constant or a callable. If a scalar, this will be used directly as kde.factor. If a callable, it should take a GaussianKDE instance as its only parameter and return a scalar. If None (default), ‘scott’ is used.
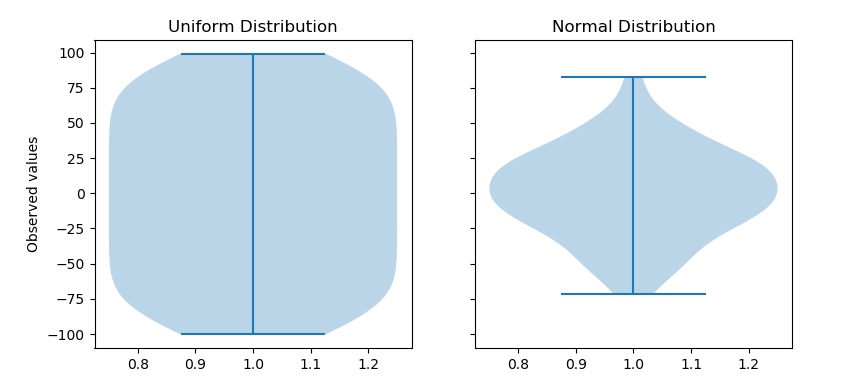
示例 1:
import numpy as np
import matplotlib.pyplot as plt

# creating a list of
# uniformly distributed values
uniform = np.arange(-100, 100)

# creating a list of normally
# distributed values
normal = np.random.normal(size = 100)*30

# creating figure and axes to
# plot the image
fig, (ax1, ax2) = plt.subplots(nrows = 1,
                               ncols = 2,
                               figsize =(9, 4),
                               sharey = True)

# plotting violin plot for
# uniform distribution
ax1.set_title('Uniform Distribution')
ax1.set_ylabel('Observed values')
ax1.violinplot(uniform)


# plotting violin plot for
# normal distribution
ax2.set_title('Normal Distribution')
ax2.violinplot(normal)

# Function to show the plot
plt.show()
输出:
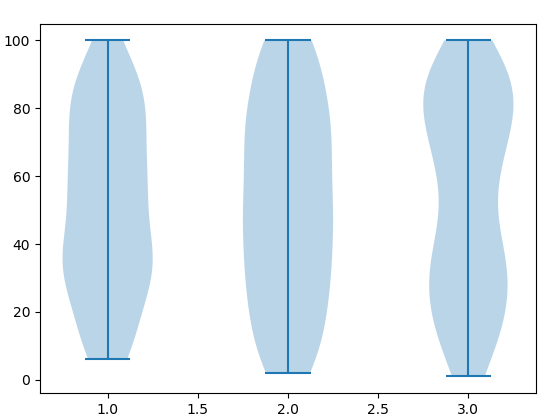
示例 2:多个小提琴图
import numpy as np
import matplotlib.pyplot as plt
from random import randint

# Creating 3 empty lists
l1 = []
l2 =[]
l3 =[]

# Filling the lists with random value
for i in range(100):
    n = randint(1, 100)
    l1.append(n)

for i in range(100):
    n = randint(1, 100)
    l2.append(n)

for i in range(100):
    n = randint(1, 100)
    l3.append(n)

random_collection = [l1, l2, l3]

# Create a figure instance
fig = plt.figure()

# Create an axes instance
ax = fig.gca()

# Create the violinplot
violinplot = ax.violinplot(random_collection)
plt.show()
输出: