与 OpenCV、scikit-image 和Python匹配的直方图
直方图匹配用于规范化图像的表示,它可以用于特征匹配,特别是当图片来自不同来源或在不同条件下(取决于光线等)。每个图像都有多个通道,每个通道单独匹配。只有当输入图像和参考图像中的通道数匹配时,才能进行直方图匹配。
直方图匹配的主要目标是:
- 对于每个图像,我们需要创建直方图。
- 看一下参考图像的直方图。
- 使用参考直方图,更新输入图片中的像素强度值,使其匹配。
match_histograms() 方法:
该方法用于修改一张图片的累积直方图以匹配另一张图片的直方图。对于每个通道,单独进行修改。
Syntax: skimage.exposure.match_histograms(image, reference, *, channel_axis=None, multichannel=False)
Parameters:
- image: ndarray. This parameter is our input image it can be grayscale or a colour image.
- reference: reference image. reference image to match histograms.
- channel_axis: optional parameter. int or None. If None is specified, the picture will be presumed to be grayscale (single channel). if not, this argument specifies the array axis that corresponds to channels.
- multichannel: optional parameter. boolean value. Matching should be done independently for each channel. This option has been deprecated; instead, use the channel axis.
示例 1:使用 OpenCV 和 scikit-image。
代码首先导入必要的包,使用 OpenCV 的 imread() 方法读取图像,然后我们检查输入图像和参考图像的通道数,如果它们不匹配,我们将无法执行直方图匹配。 match_histograms 用于查找匹配的图像。为每个通道绘制直方图。
Python3
# import packages
import matplotlib.pyplot as plt
from skimage import exposure
from skimage.exposure import match_histograms
import cv2

# reading main image
img1 = cv2.imread("img.jpeg")

# checking the number of channels
print('No of Channel is: ' + str(img1.ndim))

# reading reference image
img2 = cv2.imread("2Fw13.jpeg")

# checking the number of channels
print('No of Channel is: ' + str(img2.ndim))

image = img1
reference = img2

matched = match_histograms(image, reference ,
                           multichannel=True)


fig, (ax1, ax2, ax3) = plt.subplots(nrows=1, ncols=3,
                                    figsize=(8, 3),
                                    sharex=True, sharey=True)

for aa in (ax1, ax2, ax3):
    aa.set_axis_off()

ax1.imshow(image)
ax1.set_title('Source')
ax2.imshow(reference)
ax2.set_title('Reference')
ax3.imshow(matched)
ax3.set_title('Matched')

plt.tight_layout()
plt.show()

fig, axes = plt.subplots(nrows=3, ncols=3, figsize=(8, 8))

for i, img in enumerate((image, reference, matched)):
    for c, c_color in enumerate(('red', 'green', 'blue')):
        img_hist, bins = exposure.histogram(img[..., c],
                                            source_range='dtype')
        axes[c, i].plot(bins, img_hist / img_hist.max())
        img_cdf, bins = exposure.cumulative_distribution(img[..., c])
        axes[c, i].plot(bins, img_cdf)
        axes[c, 0].set_ylabel(c_color)

axes[0, 0].set_title('Source')
axes[0, 1].set_title('Reference')
axes[0, 2].set_title('Matched')

plt.tight_layout()
plt.show()
Python3
# importing packages
import matplotlib.pyplot as plt
from skimage import data
from skimage import exposure
from skimage.exposure import match_histograms

# loading data
reference = data.moon()
image = data.camera()

# matching histograms
matched = match_histograms(image, reference,
                           multichannel=True,)

fig, (ax1, ax2, ax3) = plt.subplots(nrows=1,
                                    ncols=3,
                                    figsize=(8, 3),
                                    sharex=True,
                                    sharey=True)
for aa in (ax1, ax2, ax3):
    aa.set_axis_off()

# displaying images
ax1.imshow(image)
ax1.set_title('Source image')
ax2.imshow(reference)
ax2.set_title('Reference image')
ax3.imshow(matched)
ax3.set_title('Matched image')

plt.tight_layout()
plt.show()
Python3
# displaying histograms.
fig, axes = plt.subplots(nrows=3, ncols=3, figsize=(8, 8))

for i, img in enumerate((image, reference, matched)):
    for c, c_color in enumerate(('red', 'green', 'blue')):
        img_hist, bins = exposure.histogram(img[..., c],
                                            source_range='dtype')
        axes[c, i].plot(bins, img_hist / img_hist.max())
        img_cdf, bins = exposure.cumulative_distribution(img[..., c])
        axes[c, i].plot(bins, img_cdf)
        axes[c, 0].set_ylabel(c_color)

axes[0, 0].set_title('Source image')
axes[0, 1].set_title('Reference image')
axes[0, 2].set_title('Matched image')

plt.tight_layout()
plt.show()
输出:


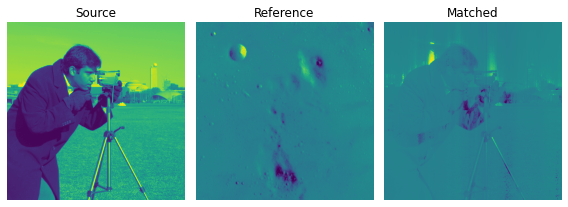
示例 2:仅使用 scikit-image:
这个例子与前面的例子类似,只是我们从 skimage.data 包中加载图像。然后我们匹配直方图,显示图像,绘制直方图。
Python3
# importing packages
import matplotlib.pyplot as plt
from skimage import data
from skimage import exposure
from skimage.exposure import match_histograms

# loading data
reference = data.moon()
image = data.camera()

# matching histograms
matched = match_histograms(image, reference,
                           multichannel=True,)

fig, (ax1, ax2, ax3) = plt.subplots(nrows=1,
                                    ncols=3,
                                    figsize=(8, 3),
                                    sharex=True,
                                    sharey=True)
for aa in (ax1, ax2, ax3):
    aa.set_axis_off()

# displaying images
ax1.imshow(image)
ax1.set_title('Source image')
ax2.imshow(reference)
ax2.set_title('Reference image')
ax3.imshow(matched)
ax3.set_title('Matched image')

plt.tight_layout()
plt.show()
输出”
显示上述图像的直方图。
Python3
# displaying histograms.
fig, axes = plt.subplots(nrows=3, ncols=3, figsize=(8, 8))

for i, img in enumerate((image, reference, matched)):
    for c, c_color in enumerate(('red', 'green', 'blue')):
        img_hist, bins = exposure.histogram(img[..., c],
                                            source_range='dtype')
        axes[c, i].plot(bins, img_hist / img_hist.max())
        img_cdf, bins = exposure.cumulative_distribution(img[..., c])
        axes[c, i].plot(bins, img_cdf)
        axes[c, 0].set_ylabel(c_color)

axes[0, 0].set_title('Source image')
axes[0, 1].set_title('Reference image')
axes[0, 2].set_title('Matched image')

plt.tight_layout()
plt.show()
输出:
