在Python中使用 Altair 绘制面积图
先决条件:用Python介绍 Altair
面积图显示了数量相对于其他变量的变化。它只是一个折线图,其中曲线下方的区域是彩色/阴影的。它最适合用于可视化一段时间内的趋势,您希望查看一个变量的值在一段时间内或相对于另一个变量的变化情况,而不关心确切的数据值。面积图的一些修改是堆积面积图和流图。
面积图在 Altair 中很容易获得,并且可以使用 mark_area()函数来应用。
创建面积图
要制作面积图,只需从数据集中选择合适的变量并将它们映射到 x 和 y 编码,其中定量变量应映射到 x 编码。
本文使用的数据集来自 Vega_datasets 库。
代码:
Python3
# Python3 program to illustrate
# How to make an area chart
# using the altair library

# Importing altair and vega_datasets
import altair as alt
from vega_datasets import data

# Selecting the sp500 dataset
sp500 = data.sp500()

# Making the area graph
# using the mark_area function
alt.Chart(sp500).mark_area().encode(

  # Map the date to x-axis
    x = 'date',

  # Map the price to y-axis
    y = 'price'
)
Python3
# Python3 program to illustrate
# How to make an area chart
# using the altair library

# Importing altair and vega_datasets
import altair as alt
from vega_datasets import data

# Selecting the sp500 dataset
sp500 = data.sp500()

# Making the area graph
alt.Chart(sp500).mark_area(color = 'green',
                           opacity = 0.5,
                           line = {'color':'darkgreen'}).encode(

  # Map the date to x-axis
    x = 'date',

  # Map the price to y-axis
    y = 'price'
)
输出:
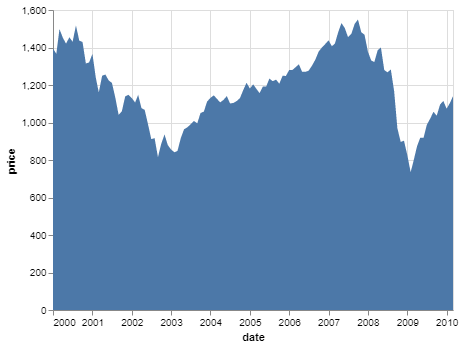
使用 Altair 的简单面积图
自定义面积图
可以在面积图上完成以下简单的自定义:
- 区域颜色:可以通过设置mark_area()方法的颜色参数来改变区域颜色的默认颜色。
- 不透明度:可以通过设置mark_area()方法的opacity参数来改变区域的默认不透明度。它的范围从 0 到 1。
- 线条颜色:您还可以通过在 mark_area() 方法的线条字典参数中指定颜色键的值来更改实际线条图的颜色。
例子:
蟒蛇3
# Python3 program to illustrate
# How to make an area chart
# using the altair library

# Importing altair and vega_datasets
import altair as alt
from vega_datasets import data

# Selecting the sp500 dataset
sp500 = data.sp500()

# Making the area graph
alt.Chart(sp500).mark_area(color = 'green',
                           opacity = 0.5,
                           line = {'color':'darkgreen'}).encode(

  # Map the date to x-axis
    x = 'date',

  # Map the price to y-axis
    y = 'price'
)
输出:
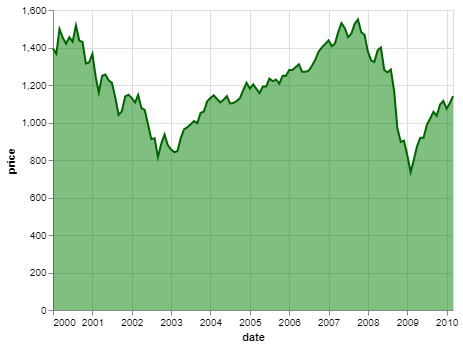
使用 Altair 定制面积图