Python中的 Matplotlib.markers 模块
Matplotlib是Python中用于数组二维图的惊人可视化库。 Matplotlib 是一个基于 NumPy 数组构建的多平台数据可视化库,旨在与更广泛的 SciPy 堆栈配合使用。
Matplotlib.markers
matplotlib.dates 模块提供处理 Matplotlib 中标记的函数。绘图和散点图的标记功能都使用它。
下表定义了 matplotlib 中所有可能的标记:
Marker Description “.” point “, “ pixel “o” circle “v” triangle_down “^” triangle_up “<“ triangle_left “>” triangle_right “1” tri_down “2” tri_up “3” tri_left “4” tri_right “8” octagon “s” square “p” pentagon “P” plus (filled) “*” star “h” hexagon1 “H” hexagon2 “+” plus “x” x “X” x (filled) “D” diamond “d” thin_diamond “|” vline “_” hline 0 (TICKLEFT) tickleft 1 (TICKRIGHT) tickright 2 (TICKUP) tickup 3 (TICKDOWN) tickdown 4 (CARETLEFT) caretleft 5 (CARETRIGHT) caretright 6 (CARETUP) caretup 7 (CARETDOWN) caretdown 8 (CARETLEFTBASE) caretleft (centered at base) 9 (CARETRIGHTBASE) caretright (centered at base) 10 (CARETUPBASE) caretup (centered at base) 11 (CARETDOWNBASE) caretdown (centered at base) “None”, ” ” or “” nothing ‘$…$’ Render the string using mathtext. E.g “$r$” for marker showing the letter r. verts A list of (x, y) pairs used for Path vertices. The center of the marker is located at (0, 0) and the size is normalized, such that the created path is encapsulated inside the unit cell. path A Path instance (numsides, style, angle) The marker can also be a tuple (numsides, style, angle), which will create a custom, regular symbol.
A) numsides: the number of sides
B) style: the style of the regular symbol,
0: a regular polygon
1: a star-like symbol
2: an asterisk
C) angle: the angle of rotation of the symbol
注意:需要注意的是下面两行代码是等价的,
# line 1
plt.plot([1, 2, 3], marker = 9)

# line 2
plt.plot([1, 2, 3], marker = matplotlib.markers.CARETRIGHTBASE)
示例 1:
Python3
import numpy as np
import matplotlib.pyplot as plt
from matplotlib.lines import Line2D


# Draw 5 points for each line
each_point = np.ones(5)
style = dict(color = 'tab:green',
             linestyle = ':',
             marker = 'D',
             markersize = 15,
             markerfacecoloralt = 'tab:red')

figure, axes = plt.subplots()

# Plot all filling styles.
for y, fill_style in enumerate(Line2D.fillStyles):

    axes.text(-0.5, y,
              repr(fill_style),
              horizontalalignment = 'center',
              verticalalignment = 'center')

    axes.plot(y * each_point, fillstyle = fill_style,
              **style)

axes.set_axis_off()
axes.set_title('filling style')

plt.show()
Python3
import numpy as np
import matplotlib.pyplot as plt
from matplotlib.lines import Line2D
# Drawing 3 points for each line
plotted_points = np.ones(4)
txt_style = dict(horizontalalignment = 'right',
verticalalignment = 'center',
fontsize = 12,
fontdict = {'family': 'monospace'})
style = dict(linestyle = ':',
color ='0.5',
markersize = 10,
mfc ="C0",
mec ="C0")
# helper function for axes formatting
def format_ax(ax):
ax.margins(0.2)
ax.set_axis_off()
ax.invert_yaxis()
# helper function for splitting list
def split(a_list):
i_half = len(a_list) // 2
return (a_list[:i_half], a_list[i_half:])
figure, axes = plt.subplots(ncols = 2)
for ax, markers in zip(axes, split(Line2D.filled_markers)):
for y, marker in enumerate(markers):
ax.text(-0.5, y, repr(marker), **txt_style)
ax.plot(y * plotted_points, marker = marker,
**style)
format_ax(ax)
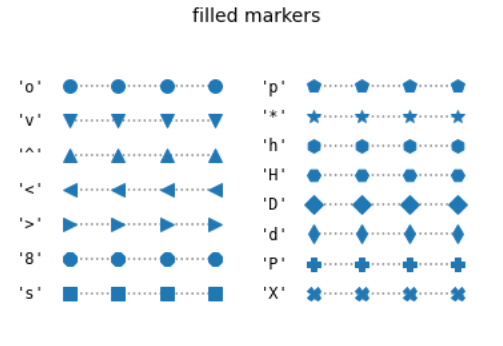
figure.suptitle('filled markers', fontsize = 14)
plt.show()输出:

示例 2:
Python3
import numpy as np
import matplotlib.pyplot as plt
from matplotlib.lines import Line2D


# Drawing 3 points for each line
plotted_points = np.ones(4)
txt_style = dict(horizontalalignment = 'right',
                 verticalalignment = 'center',
                 fontsize = 12,
                 fontdict = {'family': 'monospace'})

style = dict(linestyle = ':',
             color ='0.5',
             markersize = 10,
             mfc ="C0",
             mec ="C0")


# helper function for axes formatting
def format_ax(ax):

    ax.margins(0.2)
    ax.set_axis_off()
    ax.invert_yaxis()


# helper function for splitting list
def split(a_list):

    i_half = len(a_list) // 2
    return (a_list[:i_half], a_list[i_half:])

figure, axes = plt.subplots(ncols = 2)

for ax, markers in zip(axes, split(Line2D.filled_markers)):

    for y, marker in enumerate(markers):

        ax.text(-0.5, y, repr(marker), **txt_style)
        ax.plot(y * plotted_points, marker = marker,
                **style)

    format_ax(ax)

figure.suptitle('filled markers', fontsize = 14)

plt.show()
输出: