使用 Python-OpenCV 计算对象的数量
在本文中,我们将使用图像处理在Python中使用 OpenCV 计算对象的数量。
需要的模块
- OpenCv : OpenCv 是一个开源库,可用于计算机视觉应用,例如图像处理、视频处理、面部识别和检测等。
- Numpy : Numpy 是一个用于科学计算的Python包。它是一个流行的机器学习数学库。 Numpy 的主要对象是一个多维数组。
- Matplotlib : Matplotlib 是一个Python库,用于数据可视化和数据的图形绘制。
使用的图像:。

分步实施
第 1 步:导入所需的库。
Python3
# Import libraries
import cv2
import numpy as np
import matplotlib.pyplot as plt
Python3
image = cv2.imread('coins.jpg')
gray = cv2.cvtColor(image, cv2.COLOR_BGR2GRAY)
plt.imshow(gray, cmap='gray')
Python3
blur = cv2.GaussianBlur(gray, (11, 11), 0)
plt.imshow(blur, cmap='gray')
Python3
canny = cv2.Canny(blur, 30, 150, 3)
plt.imshow(canny, cmap='gray')
Python3
dilated = cv2.dilate(canny, (1, 1), iterations=0)
plt.imshow(dilated, cmap='gray')
Python3
(cnt, heirarchy) = cv2.findContours(
    dilated.copy(), cv2.RETR_EXTERNAL, cv2.CHAIN_APPROX_NONE)
rgb = cv2.cvtColor(image, cv2.COLOR_BGR2RGB)
cv2.drawContours(rgb, cnt, -1, (0, 255, 0), 2)

plt.imshow(rgb)
Python3
print("coins in the image : ", len(cnt))Python3
# Import libraries
import cv2
import numpy as np
import matplotlib.pyplot as plt

image = cv2.imread('coins.jpg')
gray = cv2.cvtColor(image, cv2.COLOR_BGR2GRAY)

blur = cv2.GaussianBlur(gray, (11, 11), 0)
canny = cv2.Canny(blur, 30, 150, 3)
dilated = cv2.dilate(canny, (1, 1), iterations=0)

(cnt, heirarchy) = cv2.findContours(
    dilated.copy(), cv2.RETR_EXTERNAL, cv2.CHAIN_APPROX_NONE)
rgb = cv2.cvtColor(image, cv2.COLOR_BGR2RGB)
cv2.drawContours(rgb, cnt, -1, (0, 255, 0), 2)


print("coins in the image : ", len(cnt))
第 2 步:我们将使用“cv2.imread(image-name)”命令读取图像,然后使用“cv2.cvtColor(image-name, cv2.COLOR_BGR2GRAY)”命令将此图像转换为灰度图像。
蟒蛇3
image = cv2.imread('coins.jpg')
gray = cv2.cvtColor(image, cv2.COLOR_BGR2GRAY)
plt.imshow(gray, cmap='gray')
输出:

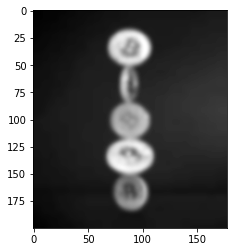
第 3 步:对于计数,我们必须检测边缘,但在检测边缘之前,我们必须使图像模糊以避免噪声。使用“cv2.GaussianBlur(image-name, Kernal size, std.deviation)” 。
蟒蛇3
blur = cv2.GaussianBlur(gray, (11, 11), 0)
plt.imshow(blur, cmap='gray')
输出:
第 4 步:现在我们将使用 canny 算法检测边缘,cv2.canny()函数中的第二个和第三个参数是阈值。 30 和 150 之间的值被视为该图像的边缘。
蟒蛇3
canny = cv2.Canny(blur, 30, 150, 3)
plt.imshow(canny, cmap='gray')
输出:

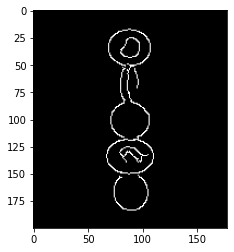
第 5 步:我们可以看到边没有连接。我们需要连接边缘,必须使更多的厚度和可见性。
蟒蛇3
dilated = cv2.dilate(canny, (1, 1), iterations=0)
plt.imshow(dilated, cmap='gray')
输出:
第 6 步:现在我们必须计算图像中的轮廓并将图像从 BGR 转换为 RGB,然后绘制轮廓。
蟒蛇3
(cnt, heirarchy) = cv2.findContours(
    dilated.copy(), cv2.RETR_EXTERNAL, cv2.CHAIN_APPROX_NONE)
rgb = cv2.cvtColor(image, cv2.COLOR_BGR2RGB)
cv2.drawContours(rgb, cnt, -1, (0, 255, 0), 2)

plt.imshow(rgb)
输出:
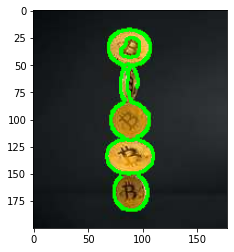
第 7 步:打印结果
蟒蛇3
print("coins in the image : ", len(cnt))
输出:
coins in the image: 5下面是完整的实现:
蟒蛇3
# Import libraries
import cv2
import numpy as np
import matplotlib.pyplot as plt

image = cv2.imread('coins.jpg')
gray = cv2.cvtColor(image, cv2.COLOR_BGR2GRAY)

blur = cv2.GaussianBlur(gray, (11, 11), 0)
canny = cv2.Canny(blur, 30, 150, 3)
dilated = cv2.dilate(canny, (1, 1), iterations=0)

(cnt, heirarchy) = cv2.findContours(
    dilated.copy(), cv2.RETR_EXTERNAL, cv2.CHAIN_APPROX_NONE)
rgb = cv2.cvtColor(image, cv2.COLOR_BGR2RGB)
cv2.drawContours(rgb, cnt, -1, (0, 255, 0), 2)


print("coins in the image : ", len(cnt))
输出:
coins in the image : 5