如何将 Gamma 分布拟合到 R 中的数据集
Gamma 分布专门用于确定指数分布、Erlang 分布和卡方分布。它也被称为具有连续概率分布的二参数族。
逐步实施
步骤 1:在 R 中安装并导入 fitdistrplus 包:
install.package("fitdistrplus")
library(fitdistrplus)
fitdistrplus 包为我们提供了 fitdist函数来拟合分布。
句法:
fitdist(dataset, distr = “choice”, method = “method”)
Here,
- distr = “choice” : It represents the distribution choice
- method = “method” : It represents the method of fitting the data
第 2 步:现在,我们将借助伽马分布拟合数据集数据,并借助最大似然估计方法拟合数据集。
R
# Generating 20 random values that uses
# a gamma distribution having shape
# parameter as 10
# combined with some gaussian noise
data <- rgamma(20, 3, 10) + rnorm(20, 0, .02)

# Fit the dataset to a gamma distribution
# using mle
ans <- fitdist(data, distr = "gamma", method = "mle")

# Display the summary of ans
summary(ans)
R
# Import the package
library(fitdistrplus)

# Generating 20 random values that uses a
# gamma distribution having shape parameter
# as 10
# combined with some gaussian noise
data <- rgamma(20, 3, 10) + rnorm(20, 0, .02)

# Fitting the dataset to a gamma distribution
# with the help of mle
ans <- fitdist(data, distr = "gamma", method = "mle")

# Display the plot
plot(ans)
R
# Import the package
library(fitdistrplus)
# Generating 20 random values that uses a
# gamma distribution having shape parameter
# as 10
# combined with some gaussian noise
data <- rgamma(20, 3, 10) + rnorm(20, 0, .02)
# Fitting the dataset to a gamma distribution
# with the help of mle
ans <- fitdist(data, distr = "gamma", method = "mle")
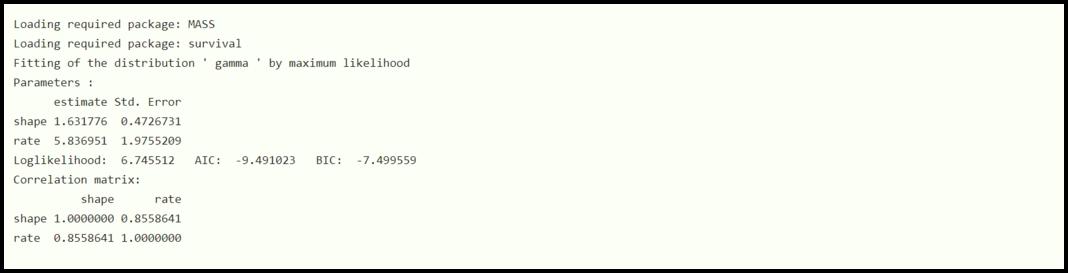
# Display the summary of the ans
summary(ans)
# Display the plot
plot(ans)输出:
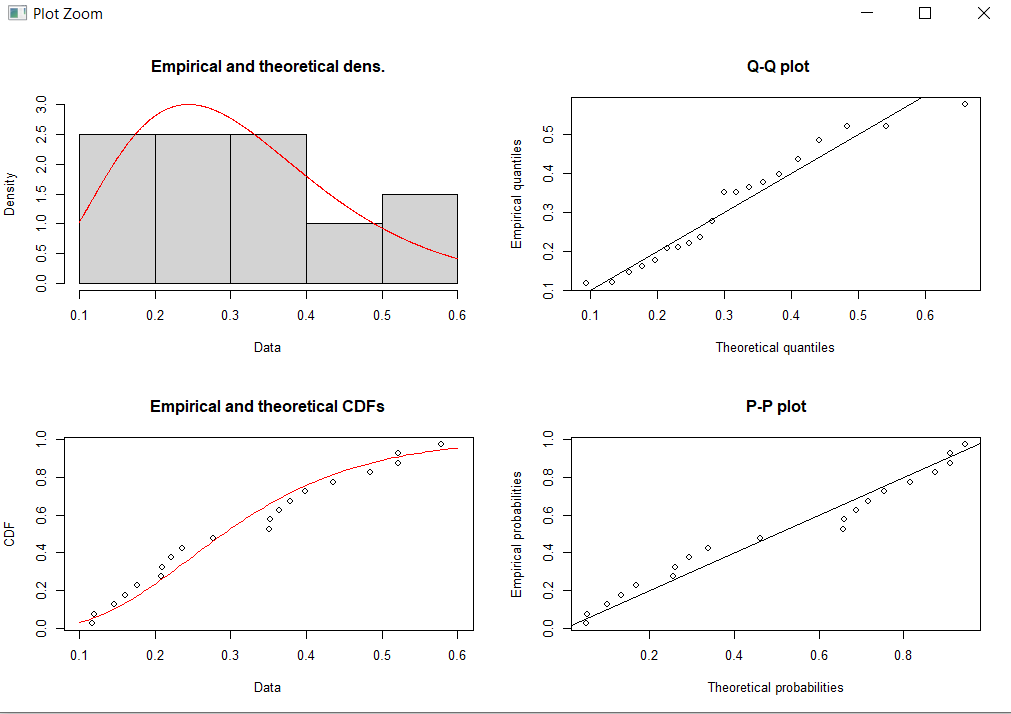
现在我们将生成一些图,这些图将在以下语法的帮助下显示 gamma 分布与数据集的拟合程度。
R
# Import the package
library(fitdistrplus)

# Generating 20 random values that uses a
# gamma distribution having shape parameter
# as 10
# combined with some gaussian noise
data <- rgamma(20, 3, 10) + rnorm(20, 0, .02)

# Fitting the dataset to a gamma distribution
# with the help of mle
ans <- fitdist(data, distr = "gamma", method = "mle")

# Display the plot
plot(ans)
输出:

例子:
R
# Import the package
library(fitdistrplus)

# Generating 20 random values that uses a
# gamma distribution having shape parameter
# as 10
# combined with some gaussian noise
data <- rgamma(20, 3, 10) + rnorm(20, 0, .02)

# Fitting the dataset to a gamma distribution
# with the help of mle
ans <- fitdist(data, distr = "gamma", method = "mle")

# Display the summary of the ans
summary(ans)

# Display the plot
plot(ans)
输出: