在 R 中组合长度不等的向量或数据帧
在本文中,我们将了解如何在 R 编程语言中将长度不等的向量或 DataFrame 组合成一个 DataFrame。
使用的功能:
- c(“Value1”, “Value2”, “Value3”) :这是一个通用函数,它结合了它的参数。默认方法将其参数(值)组合起来形成一个向量。
- length(vector):获取或设置向量、因子或任何其他 R 对象的长度。
- max(...):返回传入参数的所有值的最大值。
- rep(x, ...):复制 x 中的值,第二个参数可以是任何时间,length(), length.out, each。
分步实施:
第 1 步:使用 c()函数为数据帧准备向量。在这里,我们将学生数据和Rollno 、 Name 、 Marks和Age设为向量。正如您在下面看到的,我们只有前三个学生的姓名和年龄。我们没有其他三个人的姓名和年龄数据。此外,我们没有最后一个学生的标记。
R
Rollno <- c("5", "6", "7", "8", "9", "10")
Name <- c("John Doe", "Jane Doe", "Bill Gates")
Marks <- c("80", "75", "95", "96", "70", "86")
Age <- c("13", "13", "14")
R
Rollno <- c("5", "6", "7", "8", "9", "10")       # length = 6
Name <- c("John Doe","Jane Doe", "Bill Gates")   # length = 3
Marks <- c("80", "75", "95", "96", "70")         # length = 5
Age <- c("13", "13", "14")                       # length = 3

maxlength = max(length(Rollno), length(Name),
                length(Marks), length(Age))
print(maxlength)
R
Rollno <- c("5", "6", "7", "8", "9", "10")
Name <- c("John Doe","Jane Doe", "Bill Gates")
Marks <- c("80", "75", "95", "96", "70")
Age <- c("13", "13", "14")
maxlength = max(length(Rollno), length(Name),
                length(Marks), length(Age))

Rollno = c(Rollno, rep(NA, maxlength - length(Rollno)))

# fill last three spaces by NA.
Name = c(Name, rep(NA, maxlength - length(Name)))

# fill last one spaces by NA.
Marks = c(Marks, rep(NA, maxlength - length(Marks)))

# fill last three spaces by NA.
Age = c(Age, rep(NA, maxlength - length(Age)))
R
Rollno <- c("5", "6", "7", "8", "9", "10")
Name <- c("John Doe","Jane Doe", "Bill Gates")
Marks <- c("80", "75", "95", "96", "70")
Age <- c("13", "13", "14")

maxlength = max(length(Rollno), length(Name),
                length(Marks), length(Age))

Rollno = c(Rollno, rep(NA, maxlength - length(Rollno)))
Name = c(Name, rep(NA, maxlength - length(Name)))
Marks = c(Marks, rep(NA, maxlength - length(Marks)))
Age = c(Age, rep(NA, maxlength - length(Age)))

studentdata <- data.frame(Rollno, Name, Marks, Age)
display(studentdata)
Step 2:如上数据所示,Rollno、Name、Marks、Age的长度分别为6、3、5、3。现在,通过使用max()函数。在 max()函数,我们通过length()函数获得所有向量的长度。我们将获得我们创建的最大长度的整体向量,并将这个长度存储到maxlength变量中。此外,为了测试目的,通过打印来检查长度。
电阻
Rollno <- c("5", "6", "7", "8", "9", "10")       # length = 6
Name <- c("John Doe","Jane Doe", "Bill Gates")   # length = 3
Marks <- c("80", "75", "95", "96", "70")         # length = 5
Age <- c("13", "13", "14")                       # length = 3

maxlength = max(length(Rollno), length(Name),
                length(Marks), length(Age))
print(maxlength)
输出:
6第 3 步:向量 Name 和 Age 的长度为 3,Marks 的长度为 5。因此,我们应该用NA值替换剩余的黑色位置。为此,我们将使用rep()函数,其中第一个参数是 NA,这里我们使用剩余黑色位置的长度作为第二个参数。之后,用 NA 填充黑色空间,我们将通过相同的c()函数更新向量。
电阻
Rollno <- c("5", "6", "7", "8", "9", "10")
Name <- c("John Doe","Jane Doe", "Bill Gates")
Marks <- c("80", "75", "95", "96", "70")
Age <- c("13", "13", "14")
maxlength = max(length(Rollno), length(Name),
                length(Marks), length(Age))

Rollno = c(Rollno, rep(NA, maxlength - length(Rollno)))

# fill last three spaces by NA.
Name = c(Name, rep(NA, maxlength - length(Name)))

# fill last one spaces by NA.
Marks = c(Marks, rep(NA, maxlength - length(Marks)))

# fill last three spaces by NA.
Age = c(Age, rep(NA, maxlength - length(Age)))
第 4 步:现在,我们将使用data.frame()函数创建一个更新向量的DataFrame并将其存储到studentdata变量中。
电阻
Rollno <- c("5", "6", "7", "8", "9", "10")
Name <- c("John Doe","Jane Doe", "Bill Gates")
Marks <- c("80", "75", "95", "96", "70")
Age <- c("13", "13", "14")

maxlength = max(length(Rollno), length(Name),
                length(Marks), length(Age))

Rollno = c(Rollno, rep(NA, maxlength - length(Rollno)))
Name = c(Name, rep(NA, maxlength - length(Name)))
Marks = c(Marks, rep(NA, maxlength - length(Marks)))
Age = c(Age, rep(NA, maxlength - length(Age)))

studentdata <- data.frame(Rollno, Name, Marks, Age)
display(studentdata)
输出:
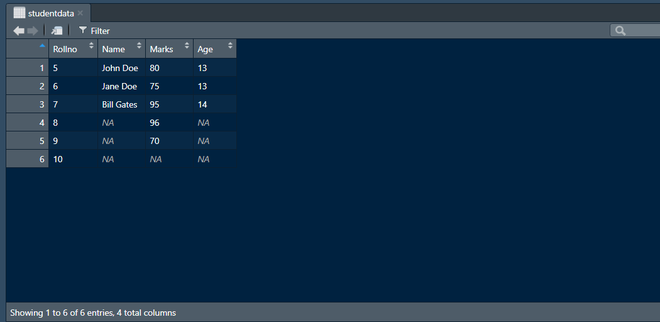
“学生数据”数据框