使用 Matplotlib 的自相关图
自相关图是检查数据集中随机性的常用工具。这种随机性是通过计算不同时间滞后的数据值的自相关来确定的。
自相关图的特征:
- 它根据一组过去的值测量一组当前值,并确定它们是否相关。
- 它是一个时间序列数据与另一个具有时间滞后的时间序列数据的相关性。
- 它从+1到-1不等。
- +1 自相关表明,如果时间序列 1 的值增加,则时间序列 2 也与时间序列 1 的变化成比例地增加。
- 自相关为 -1 表示如果时间序列 1 的值增加,则时间序列 2 与时间序列 1 的变化成比例地减小。
自相关的应用:
- 模式识别。
- 信号检测。
- 信号处理。
- 估计音高。
- 股票的技术分析。
绘制自相关图
要绘制自相关图,我们可以使用 matplotlib 并使用 matplotlib.pyplot.acorr()函数轻松绘制它。
Syntax: matplotlib.pyplot.acorr(x, *, data=None, **kwargs)
Parameters:
- ‘x’ : This parameter is a sequence of scalar.
- ‘detrend’ : This parameter is an optional parameter. Its default value is mlab.detrend_none.
- ‘normed’ : This parameter is also an optional parameter and contains the bool value. Its default value is True.
- ‘usevlines’ : This parameter is also an optional parameter and contains the bool value. Its default value is True.
- ‘maxlags’ : This parameter is also an optional parameter and contains the integer value. Its default value is 10.
- ‘linestyle’ : This parameter is also an optional parameter and used for plotting the data points, only when usevlines is False.
- ‘marker’ : This parameter is also an optional parameter and contains the string. Its default value is ‘o’.
Returns: (lags, c, line, b)
Where:
- lags are a length 2`maxlags+1 lag vector.
- c is the 2`maxlags+1 auto correlation vector.
- line is a Line2D instance returned by plot.
- b is the x-axis.
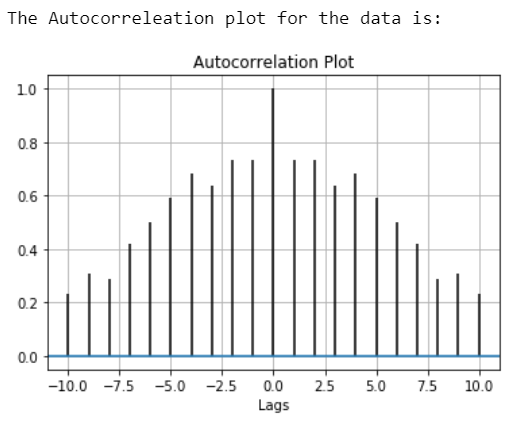
示例 1:
Python3
# Importing the libraries.
import matplotlib.pyplot as plt
import numpy as np

# Data for which we plot Autocorrelation.
data = np.array([12.0, 24.0, 7., 20.0,
                 7.0, 22.0, 18.0,22.0,
                 6.0, 7.0, 20.0, 13.0,
                 8.0, 5.0, 8])

# Adding plot title.
plt.title("Autocorrelation Plot")

# Providing x-axis name.
plt.xlabel("Lags")

# Plotting the Autocorrelation plot.
plt.acorr(data, maxlags = 10)

# Displaying the plot.
print("The Autocorrelation plot for the data is:")
plt.grid(True)

plt.show()
Python3
# Importing the libraries.
import matplotlib.pyplot as plt
import numpy as np

# Setting up the rondom seed for
# fixing the random state.
np.random.seed(42)

# Creating some random data.
data = np.random.randn(25)

# Adding plot title.
plt.title("Autocorrelation Plot")

# Providing x-axis name.
plt.xlabel("Lags")

# Plotting the Autocorrelation plot.
plt.acorr(data, maxlags = 20)

# Displaying the plot.
print("The Autocorrelation plot for the data is:")
plt.grid(True)

plt.show()
输出:
示例 2:
Python3
# Importing the libraries.
import matplotlib.pyplot as plt
import numpy as np

# Setting up the rondom seed for
# fixing the random state.
np.random.seed(42)

# Creating some random data.
data = np.random.randn(25)

# Adding plot title.
plt.title("Autocorrelation Plot")

# Providing x-axis name.
plt.xlabel("Lags")

# Plotting the Autocorrelation plot.
plt.acorr(data, maxlags = 20)

# Displaying the plot.
print("The Autocorrelation plot for the data is:")
plt.grid(True)

plt.show()
输出:
