Python| Matplotlib 使用面向对象的 API 进行子绘图
在 matplotlib 中使用面向对象 (OO) API 进行绘图是绘制图形和其他数据可视化方法的一种简单方法。
为子绘图创建类和对象的简单语法是 -
class_name, object_name = matplotlib.pyplot.subplots(‘no_of_rows’, ‘no_of_columns’)
让我们举一些例子来更清楚地说明。
示例 #1:
# importing the matplotlib library
import matplotlib.pyplot as plt

# defining the values of X
x =[0, 1, 2, 3, 4, 5, 6]

# defining the value of Y
y =[0, 1, 3, 6, 9, 12, 17]

# creating the canvas with class 'fig'
# and it's object 'axes' with '1' row
# and '2' columns
fig, axes = plt.subplots(1, 2)

# plotting graph for 1st column
axes[0].plot(x, y, 'g--o')

# plotting graph for second column
axes[1].plot(y, x, 'm--o')

# Gives a clean look to the graphs
fig.tight_layout()
输出 : 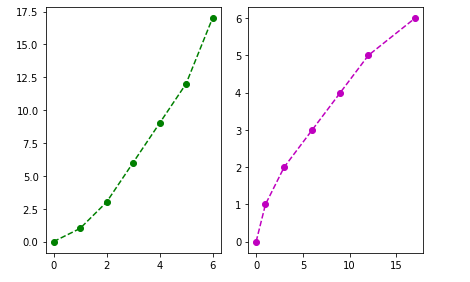
在上面的例子中,我们在绘制图形时使用'axes'('fig'类的对象)作为数组,这是因为当我们定义行数和列数时,对象的数组是用'n' 个元素,其中 'n' 是行和列的乘积,所以如果我们有 2 列和 2 行,那么将有 4 个元素的数组。
示例 #2:
# importing the matplotlib library
import matplotlib.pyplot as plt
# defining the values of X
x =[0, 1, 2, 3, 4, 5, 6]
# defining the value of Y
y =[0, 1, 3, 6, 9, 12, 17]
# creating the canvas with class 'fig'
# and it's object 'axes' with '1' row
# and '2' columns
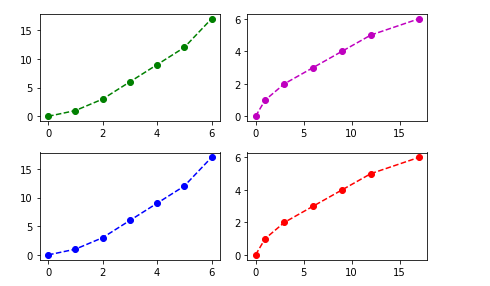
fig, axes = plt.subplots(2, 2)
# plotting graph for 1st element
axes[0, 0].plot(x, y, 'g--o')
# plotting graph for 2nd element
axes[0, 1].plot(y, x, 'm--o')
# plotting graph for 3rd element
axes[1, 0].plot(x, y, 'b--o')
# plotting graph for 4th element
axes[1, 1].plot(y, x, 'r--o')
# Gives a clean look to the graphs
fig.tight_layout()
输出 :