使用 Matplotlib 在Python中进行三维绘图
Matplotlib的引入牢记,只有二维绘图。但是在 1.0 版本发布的时候,3d 实用程序是在 2d 上开发的,因此,我们今天可以使用 3d 数据实现!通过导入 mplot3d 工具包启用 3d 绘图。在本文中,我们将使用 matplotlib 处理 3d 图。
例子:
Python3
import numpy as np
import matplotlib.pyplot as plt


fig = plt.figure()
ax = plt.axes(projection ='3d')
Python3
# importing mplot3d toolkits, numpy and matplotlib
from mpl_toolkits import mplot3d
import numpy as np
import matplotlib.pyplot as plt

fig = plt.figure()

# syntax for 3-D projection
ax = plt.axes(projection ='3d')

# defining all 3 axes
z = np.linspace(0, 1, 100)
x = z * np.sin(25 * z)
y = z * np.cos(25 * z)

# plotting
ax.plot3D(x, y, z, 'green')
ax.set_title('3D line plot geeks for geeks')
plt.show()
Python3
# importing mplot3d toolkits
from mpl_toolkits import mplot3d
import numpy as np
import matplotlib.pyplot as plt

fig = plt.figure()

# syntax for 3-D projection
ax = plt.axes(projection ='3d')

# defining axes
z = np.linspace(0, 1, 100)
x = z * np.sin(25 * z)
y = z * np.cos(25 * z)
c = x + y
ax.scatter(x, y, z, c = c)

# syntax for plotting
ax.set_title('3d Scatter plot geeks for geeks')
plt.show()
Python3
# importing libraries
from mpl_toolkits import mplot3d
import numpy as np
import matplotlib.pyplot as plt

# defining surface and axes
x = np.outer(np.linspace(-2, 2, 10), np.ones(10))
y = x.copy().T
z = np.cos(x ** 2 + y ** 3)

fig = plt.figure()

# syntax for 3-D plotting
ax = plt.axes(projection ='3d')

# syntax for plotting
ax.plot_surface(x, y, z, cmap ='viridis', edgecolor ='green')
ax.set_title('Surface plot geeks for geeks')
plt.show()
Python3
from mpl_toolkits import mplot3d
import numpy as np
import matplotlib.pyplot as plt


# function for z axea
def f(x, y):
    return np.sin(np.sqrt(x ** 2 + y ** 2))

# x and y axis
x = np.linspace(-1, 5, 10)
y = np.linspace(-1, 5, 10)

X, Y = np.meshgrid(x, y)
Z = f(X, Y)

fig = plt.figure()
ax = plt.axes(projection ='3d')
ax.plot_wireframe(X, Y, Z, color ='green')
ax.set_title('wireframe geeks for geeks');
Python3
from mpl_toolkits import mplot3d
import numpy as np
import matplotlib.pyplot as plt


# function for z axis
def f(x, y):
    return np.sin(np.sqrt(x ** 2 + y ** 3))

# x and y axis
x = np.linspace(-1, 5, 10)
y = np.linspace(-1, 5, 10)
X, Y = np.meshgrid(x, y)
Z = f(X, Y)

fig = plt.figure()
ax = plt.axes(projection ='3d')

# ax.contour3D is used plot a contour graph
ax.contour3D(X, Y, Z)
Python3
from mpl_toolkits import mplot3d
import numpy as np
import matplotlib.pyplot as plt


# angle and radius
theta = 2 * np.pi * np.random.random(100)
r = 6 * np.random.random(100)

# all three axes
x = np.ravel(r * np.sin(theta))
y = np.ravel(r * np.cos(theta))
z = f(x, y)

ax = plt.axes(projection ='3d')
ax.scatter(x, y, z, c = z, cmap ='viridis', linewidth = 0.25);

ax = plt.axes(projection ='3d')
ax.plot_trisurf(x, y, z, cmap ='viridis', edgecolor ='green');
Python3
from mpl_toolkits import mplot3d
import numpy as np
import matplotlib.pyplot as plt
from matplotlib.tri import Triangulation


theta = np.linspace(0, 2 * np.pi, 10)
w = np.linspace(-1, 5, 8)
w, theta = np.meshgrid(w, theta)
phi = 0.5 * theta

# radius in x-y plane
r = 1 + w * np.cos(phi)

# all three axes
x = np.ravel(r * np.cos(theta))
y = np.ravel(r * np.sin(theta))
z = np.ravel(w * np.sin(phi))

# triangulate in the underlying
# parameterization
tri = Triangulation(np.ravel(w), np.ravel(theta))

ax = plt.axes(projection ='3d')
ax.plot_trisurf(x, y, z, triangles = tri.triangles,
                cmap ='viridis', linewidths = 0.2);
输出:
使用上述语法,启用了三维轴,并且可以在 3 维中绘制数据。 3维图提供了一种动态的方法,使数据更具交互性。像 2-D 图一样,我们可以使用不同的方式来表示 3-D 图。我们可以制作散点图、等高线图、曲面图等。让我们看看不同的 3-D 图。
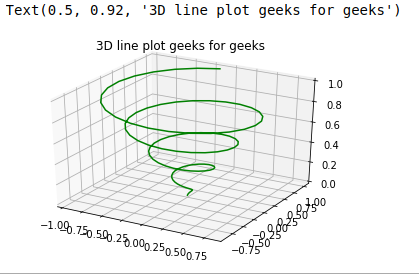
绘制 3-D 线和点
带线和点的图形是最简单的 3 维图形。 ax.plot3d 和 ax.scatter分别是绘制线图和点图的函数。
示例 1: 3 维折线图
Python3
# importing mplot3d toolkits, numpy and matplotlib
from mpl_toolkits import mplot3d
import numpy as np
import matplotlib.pyplot as plt

fig = plt.figure()

# syntax for 3-D projection
ax = plt.axes(projection ='3d')

# defining all 3 axes
z = np.linspace(0, 1, 100)
x = z * np.sin(25 * z)
y = z * np.cos(25 * z)

# plotting
ax.plot3D(x, y, z, 'green')
ax.set_title('3D line plot geeks for geeks')
plt.show()
输出:
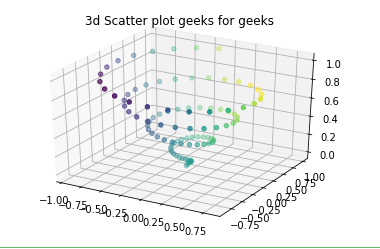
示例 2: 3 维散点图
Python3
# importing mplot3d toolkits
from mpl_toolkits import mplot3d
import numpy as np
import matplotlib.pyplot as plt

fig = plt.figure()

# syntax for 3-D projection
ax = plt.axes(projection ='3d')

# defining axes
z = np.linspace(0, 1, 100)
x = z * np.sin(25 * z)
y = z * np.cos(25 * z)
c = x + y
ax.scatter(x, y, z, c = c)

# syntax for plotting
ax.set_title('3d Scatter plot geeks for geeks')
plt.show()
输出:
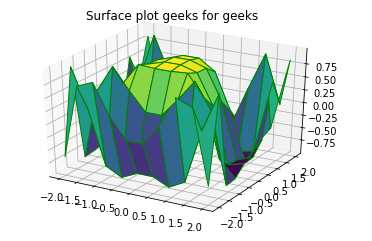
绘制曲面图和线框
曲面图和线框图适用于网格数据。他们获取网格值并将其绘制在三维表面上。
示例 1:曲面图
Python3
# importing libraries
from mpl_toolkits import mplot3d
import numpy as np
import matplotlib.pyplot as plt

# defining surface and axes
x = np.outer(np.linspace(-2, 2, 10), np.ones(10))
y = x.copy().T
z = np.cos(x ** 2 + y ** 3)

fig = plt.figure()

# syntax for 3-D plotting
ax = plt.axes(projection ='3d')

# syntax for plotting
ax.plot_surface(x, y, z, cmap ='viridis', edgecolor ='green')
ax.set_title('Surface plot geeks for geeks')
plt.show()
输出:
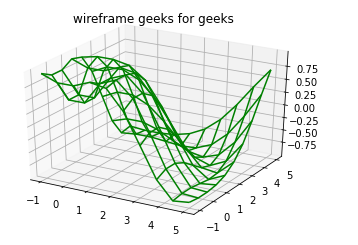
示例 2:线框
Python3
from mpl_toolkits import mplot3d
import numpy as np
import matplotlib.pyplot as plt


# function for z axea
def f(x, y):
    return np.sin(np.sqrt(x ** 2 + y ** 2))

# x and y axis
x = np.linspace(-1, 5, 10)
y = np.linspace(-1, 5, 10)

X, Y = np.meshgrid(x, y)
Z = f(X, Y)

fig = plt.figure()
ax = plt.axes(projection ='3d')
ax.plot_wireframe(X, Y, Z, color ='green')
ax.set_title('wireframe geeks for geeks');
输出:
绘制等高线图
等高线图以二维规则网格的形式获取所有输入数据,并在每个点处评估 Z 数据。我们使用ax.contour3D函数绘制等高线图。
例子:
Python3
from mpl_toolkits import mplot3d
import numpy as np
import matplotlib.pyplot as plt


# function for z axis
def f(x, y):
    return np.sin(np.sqrt(x ** 2 + y ** 3))

# x and y axis
x = np.linspace(-1, 5, 10)
y = np.linspace(-1, 5, 10)
X, Y = np.meshgrid(x, y)
Z = f(X, Y)

fig = plt.figure()
ax = plt.axes(projection ='3d')

# ax.contour3D is used plot a contour graph
ax.contour3D(X, Y, Z)
输出:

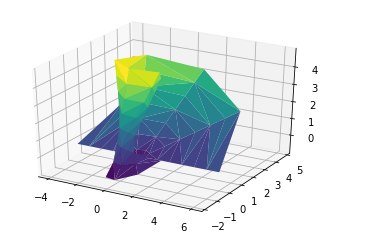
绘制曲面三角剖分
上图有时会受到过度限制和不便。所以通过这种方法,我们使用了一组随机抽奖。函数ax.plot_trisurf用于绘制此图。它不是那么清楚,但更灵活。
例子:
Python3
from mpl_toolkits import mplot3d
import numpy as np
import matplotlib.pyplot as plt


# angle and radius
theta = 2 * np.pi * np.random.random(100)
r = 6 * np.random.random(100)

# all three axes
x = np.ravel(r * np.sin(theta))
y = np.ravel(r * np.cos(theta))
z = f(x, y)

ax = plt.axes(projection ='3d')
ax.scatter(x, y, z, c = z, cmap ='viridis', linewidth = 0.25);

ax = plt.axes(projection ='3d')
ax.plot_trisurf(x, y, z, cmap ='viridis', edgecolor ='green');
输出:

绘制莫比乌斯带
莫比乌斯带也称为扭曲圆柱体,是一个没有边界的单面曲面。要创建莫比乌斯带考虑它的参数化,它是一个二维带,我们需要两个内在维度。它的角度范围从 0 到 2 饼形围绕循环,宽度范围从 -1 到 1。
例子:
Python3
from mpl_toolkits import mplot3d
import numpy as np
import matplotlib.pyplot as plt
from matplotlib.tri import Triangulation


theta = np.linspace(0, 2 * np.pi, 10)
w = np.linspace(-1, 5, 8)
w, theta = np.meshgrid(w, theta)
phi = 0.5 * theta

# radius in x-y plane
r = 1 + w * np.cos(phi)

# all three axes
x = np.ravel(r * np.cos(theta))
y = np.ravel(r * np.sin(theta))
z = np.ravel(w * np.sin(phi))

# triangulate in the underlying
# parameterization
tri = Triangulation(np.ravel(w), np.ravel(theta))

ax = plt.axes(projection ='3d')
ax.plot_trisurf(x, y, z, triangles = tri.triangles,
                cmap ='viridis', linewidths = 0.2);
输出: