增加 R 中 ggplot2 图的边界线粗细
在本文中,我们将了解如何使用 R 编程语言中的 ggplot2 条形图更改边界线厚度。
首先,如果之前未在 R Studio 中安装 ggplot2 包,则需要安装它。要安装和加载在 R 控制台中写入以下命令:
install.packages("ggplot2")
library(ggplot2)为了创建一个简单的条形图,我们将使用函数geom_bar() 。
句法:
geom_bar(stat, fill, color, width)
Parameters :
- stat : Set the stat parameter to identify the mode.
- fill : Represents color inside the bars.
- color : Represents color of outlines of the bars.
- width : Represents width of the bars.
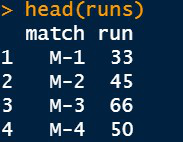
让我们创建一个数据帧,它有两个向量“match”和“run”,并将其存储在变量“runs”中。
R
# Inserting data
runs <- data.frame(match=c("M-1","M-2","M-3","M-4"),
                   run=c(33, 45, 66, 50))

head(runs)
R
# Bar Plot
library(ggplot2)


IPL <-ggplot(data=runs, aes(x=match, y=run)) +
  geom_bar(stat="identity",fill="white",color="black")+
  theme_classic()

IPL
R
# Changing the border thickness
library(ggplot2)


IPL <-ggplot(data=runs, aes(x=match, y=run)) +
  geom_bar(stat="identity",fill="white",color="black",size=2)+
  theme_classic()

IPL
R
# Inserting data
marks <- data.frame(student=c("S-1","S-2","S-3","S-4","S-5"),
                   mark=c(90, 85, 75, 78, 98))

# Changing the border thickness
library(ggplot2)


RESULT <-ggplot(data=marks, aes(x=student, y=mark)) +
  geom_bar(stat="identity",fill="yellow",color="navy",size=4,alpha=0.1)+
  theme_classic()

RESULT
输出:
条形图
电阻
# Bar Plot
library(ggplot2)


IPL <-ggplot(data=runs, aes(x=match, y=run)) +
  geom_bar(stat="identity",fill="white",color="black")+
  theme_classic()

IPL
输出:

增加边框厚度
在函数geom_bar( ) 中,使用关键字size并指定一个值来更改边框的粗细。在我们的例子中,我们为大小分配了一个值 2。我们可以观察到边界线的厚度增加了。
电阻
# Changing the border thickness
library(ggplot2)


IPL <-ggplot(data=runs, aes(x=match, y=run)) +
  geom_bar(stat="identity",fill="white",color="black",size=2)+
  theme_classic()

IPL
输出:

示例 2:考虑一个数据框,其中包含有关学生在考试中获得的分数的信息。
电阻
# Inserting data
marks <- data.frame(student=c("S-1","S-2","S-3","S-4","S-5"),
                   mark=c(90, 85, 75, 78, 98))

# Changing the border thickness
library(ggplot2)


RESULT <-ggplot(data=marks, aes(x=student, y=mark)) +
  geom_bar(stat="identity",fill="yellow",color="navy",size=4,alpha=0.1)+
  theme_classic()

RESULT
输出:
