📌 相关文章
- JavaFX |弧与示例
- JavaFX |弧与示例(1)
- 示例 javafx - Java (1)
- JavaFX-CSS
- JavaFX css(1)
- JavaFX css
- JavaFX-CSS(1)
- JavaFX-转换(1)
- JavaFX-转换
- JavaFX 文本
- JavaFX |文本域(1)
- JavaFX-文本
- JavaFX 文本(1)
- JavaFX |文本域
- JavaFX-文本(1)
- JavaFX |选择框(1)
- JavaFX |选择框
- JavaFX-颜色
- JavaFX 颜色(1)
- JavaFX-颜色(1)
- JavaFX 颜色
- JavaFX |标签类
- JavaFX |标签类(1)
- JavaFX |标签
- JavaFX |标签(1)
- JavaFX-应用程序
- JavaFX-应用程序(1)
- 示例 javafx - Java 代码示例
- JavaFX |带有示例的框
📜 javafx 饼状图
📅 最后修改于: 2020-10-14 06:19:31 🧑 作者: Mango
JavaFX PieChart
通常,饼图是一种图形或图表,其中圆的扇区用于表示整个信息的不同比例。一个扇区的弧形角度根据该扇区代表的信息百分比而变化。
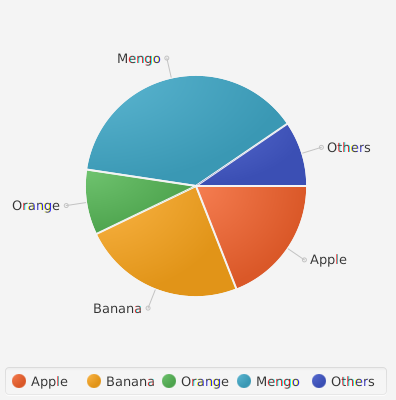
在下图中,显示了一个饼图,其扇区代表一个人在其篮子中拥有的水果量。
在JavaFX中,饼图由类javafx.scene.chart.PieChrt表示。我们需要实例化此类以创建pi-chart。
物产
下表描述了javafx.scene.chart.PieChart类的属性以及setter方法。
| Property | Description | Setter Methods |
|---|---|---|
| clockwise | It is a boolean type property. Its true value means that the slices get placed clockwise from the start angle. | setClockWise(Boolean value) |
| data | It is an observable List type property. It represents the data which is to be set in the pie chart. The class PieChart.Data is used to deal with the assignment of data to the slices of pie chart. | setData(PieChart.Data value) |
| labelLineLength | It is a double type property. It represents the length of the line from the outside of the pie to the slice labels. | setLabelLineLength(double value) |
| labelsVisible | It is a boolean type property. Its true value means that pie slice labels will be drawn. | setLabelsVisible(boolean value) |
| startAngle | It is a double type property. It represents the angle of the first pie slice. | setStartAngle(double value) |
建设者
该类中有两个构造函数。
- public PieChart():创建一个空PieChart的新实例。
- 公开PieChart(ObservableList
数据): 使用指定的数据切片创建饼图的新实例。
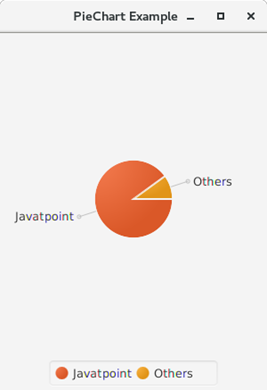
范例1:
package application;
import javafx.application.Application;
import javafx.collections.FXCollections;
import javafx.collections.ObservableList;
import javafx.geometry.Side;
import javafx.scene.Scene;
import javafx.scene.chart.PieChart;
import javafx.scene.chart.PieChart.Data;
import javafx.scene.layout.StackPane;
import javafx.stage.Stage;
public class ChartTest extends Application{
public static void main(String[] args) {
launch(args);
}

@Override
public void start(Stage primaryStage) throws Exception {
// TODO Auto-generated method stub
//Instantiating the pie-chart class
PieChart piechart = new PieChart();

//setting the data of the pie chart.
piechart.setData(getChartData());

//Creating Layout
StackPane root = new StackPane();

//Adding pie-chart to the layout
root.getChildren().add(piechart);

//configuring scene
Scene scene = new Scene(root,400,400);
primaryStage.setScene(scene);
primaryStage.setTitle("PieChart Example");
primaryStage.show();

}
//creating getChartData method to set the chart data
private ObservableList getChartData() {
    ObservableList list = FXCollections.observableArrayList();
    list.addAll(new PieChart.Data("Javatpoint", 90),
            new PieChart.Data("Others", 10));
    return list;
}
}
范例2:
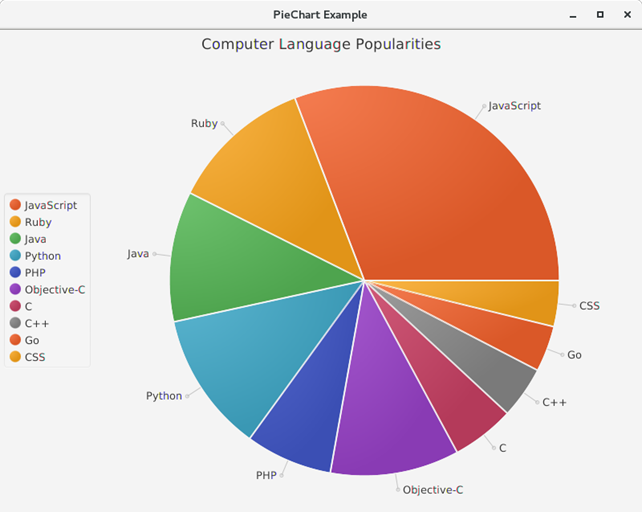
在下面的示例中,我们创建了一个饼图,该饼图显示了所有计算机编程语言的流行程度。
package application;
import javafx.application.Application;
import javafx.collections.FXCollections;
import javafx.collections.ObservableList;
import javafx.geometry.Side;
import javafx.scene.Scene;
import javafx.scene.chart.PieChart;
import javafx.scene.chart.PieChart.Data;
import javafx.scene.layout.StackPane;
import javafx.stage.Stage;
public class ChartTest extends Application{
public static void main(String[] args) {
launch(args);
}

@Override
public void start(Stage primaryStage) throws Exception {
// TODO Auto-generated method stub
//Instantiating PieChart class
PieChart piechart = new PieChart();

//Setting pieChart data
piechart.setData(getChartData());
piechart.setLegendSide(Side.LEFT);
piechart.setTitle("Computer Language Popularities");
piechart.setClockwise(false);

//Creating layout
StackPane root = new StackPane();

//Adding piechart to the layout
root.getChildren().add(piechart);

//Configuring Scene and stage object
Scene scene = new Scene(root,800,600);
primaryStage.setScene(scene);
primaryStage.setTitle("PieChart Example");
primaryStage.show();

}

//The method sets the data to the pie-chart.
private ObservableList getChartData() {
    ObservableList list = FXCollections.observableArrayList();
    list.addAll(new PieChart.Data("JavaScript", 30.8),
    new PieChart.Data("Ruby", 11.8),
    new PieChart.Data("Java", 10.8),
    new PieChart.Data("Python", 11.6),
    new PieChart.Data("PHP", 7.2),
    new PieChart.Data("Objective-C", 10.7),
    new PieChart.Data("C", 5.2),
            new PieChart.Data("C++", 4.3),
            new PieChart.Data("Go",3.8),
            new PieChart.Data("CSS", 3.8)
);
    return list;
}
}