📌 相关文章
- R – 折线图(1)
- R-折线图(1)
- R – 折线图
- R-折线图
- python折线图 - Python(1)
- javascript 折线图 - Javascript (1)
- JavaFX |弧与示例(1)
- JavaFX |弧与示例
- python折线图 - Python代码示例
- Matplotlib 中的折线图 – Python
- Matplotlib 中的折线图 – Python(1)
- javascript 折线图 - Javascript 代码示例
- PyQtGraph – 折线图(1)
- PyQtGraph – 折线图
- Tableau折线图(1)
- Tableau 中的双折线图
- Tableau 中的双折线图(1)
- Tableau-折线图
- Tableau 中的折线图
- Tableau 中的折线图(1)
- Tableau折线图
- Tableau-折线图(1)
- 示例 javafx - Java (1)
- JavaFX css(1)
- JavaFX css
- JavaFX-CSS
- JavaFX-CSS(1)
- Laravel Google 折线图 - PHP (1)
- Highcharts-折线图
📜 javafx 折线图
📅 最后修改于: 2020-10-14 06:19:46 🧑 作者: Mango
JavaFX LineChart
通常,折线图定义为图形的类型,其中使用称为标记的数据点组来显示信息。
在折线图中,标记绘制在两个数字轴之间的映射点上。标记通过线段连接。折线图基本上表示一个轴的值相对于另一个轴的值的变化的偏差。
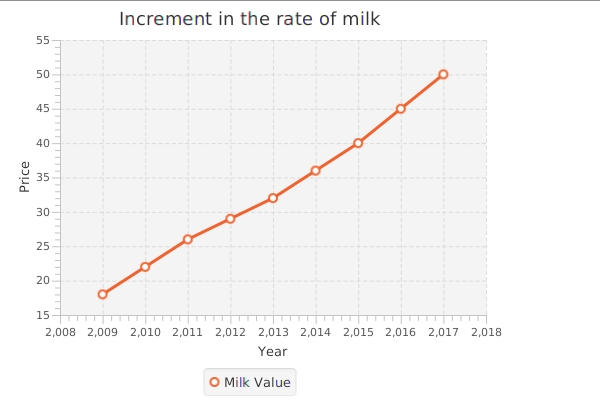
在下图中,折线图显示了过去8年中牛奶价格的变化。在Y轴上显示价格,在X轴上显示年份。
在JavaFX中,折线图由类javafx.scene.chart.LineChart表示
物产
下表描述了该类的属性以及setter方法。
| Property | Description | Setter Methods |
|---|---|---|
| axisSortingPolicy | This is an LineChart.SortingPolicy type property. It represents whether the data is to be sorted according the nature of one of the axis. | setAxisSortingProperty(LineChart.SortingPolicy value) |
| createSymbols | This is a boolean type property. It represents whether the symbols are needed to be created for the ones for which the symbol nodes are not specified. | setCreateSymbols(Boolean true) |
建设者
该类中有两个构造函数。
- 公共LineChart(Axis
X轴,轴 使用指定的轴创建LineChart的新实例。Yaxis): - 公共LineChart(Axis
X轴,轴 使用指定的轴和数据创建LineChart的新实例Yaxis,ObservableList
例
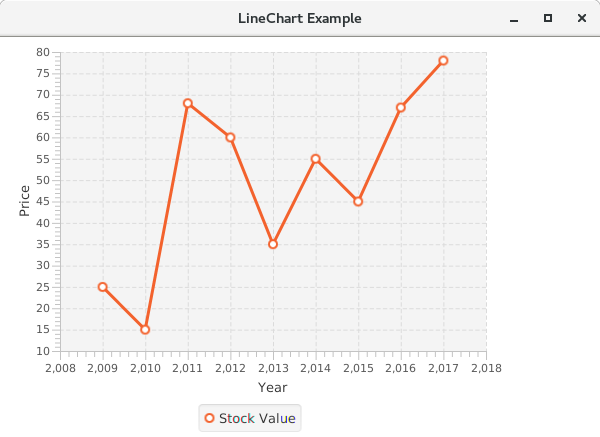
在下面的示例中,我们显示了不同年份的股票价格变化。
package application;
import javafx.application.Application;
import javafx.scene.Group;
import javafx.scene.Scene;
import javafx.scene.chart.LineChart;
import javafx.scene.chart.NumberAxis;
import javafx.scene.chart.XYChart;
import javafx.stage.Stage;
public class LineChartTest extends Application
{

@Override
public void start(Stage primaryStage) throws Exception {
// TODO Auto-generated method stub
//Defining Axis
final NumberAxis xaxis = new NumberAxis(2008,2018,1);
final NumberAxis yaxis = new NumberAxis(10,80,5);

//Defining Label for Axis
xaxis.setLabel("Year");
yaxis.setLabel("Price");

//Creating the instance of linechart with the specified axis
LineChart linechart = new LineChart(xaxis,yaxis);

//creating the series
XYChart.Series series = new XYChart.Series();

//setting name and the date to the series
series.setName("Stock Analysis");
series.getData().add(new XYChart.Data(2009,25));
series.getData().add(new XYChart.Data(2010,15));
series.getData().add(new XYChart.Data(2011,68));
series.getData().add(new XYChart.Data(2012,60));
series.getData().add(new XYChart.Data(2013,35));
series.getData().add(new XYChart.Data(2014,55));
series.getData().add(new XYChart.Data(2015,45));
series.getData().add(new XYChart.Data(2016,67));
series.getData().add(new XYChart.Data(2017,78));

//adding series to the linechart
linechart.getData().add(series);

//setting Group and Scene
Group root = new Group(linechart);
Scene scene = new Scene(root,600,400);
primaryStage.setScene(scene);
primaryStage.setTitle("LineChart Example");
primaryStage.show();
}
public static void main(String[] args) {
launch(args);
}

}