在 R 编程中将因子转换为数值和数值到因子
因子是用于对数据进行分类或表示分类数据并将其存储在多个级别上的数据结构。
它们可以存储为整数,每个唯一整数都有对应的标签。尽管因子可能看起来类似于字符向量,但它们是整数,在将它们用作字符串时必须小心。
该因子仅接受有限数量的不同值。它有助于对数据进行分类并将其存储在多个级别上。
将因子转换为数值
有时您需要将因子显式更改为数字或文本。为此,必须使用函数as.character()或as.numeric() 。将因子转换为数字有两个步骤:
步骤 1:将数据向量转换为因子。 factor()命令用于在 R 中创建和修改因子。
第 2 步:使用as.numeric()将因子转换为数值向量。
将因子转换为数值向量时,将返回因子水平对应的数值代码。
例子:
取一个由方向组成的数据向量“V”,其因子将转换为数字。
# Data Vector 'V'
V = c("North", "South", "East", "East")

# Convert vector 'V' into a factor
drn <- factor(V)

# Converting a factor into a numeric vector
as.numeric(drn)
输出:
[1] 2 3 1 1
转换为数字的因子:
如果因子是数字,首先将其转换为字符向量,然后再转换为数字。如果一个因素是一个字符,那么你不需要将它转换为一个字符。如果您尝试将字母字符转换为数字,它将返回 NA。
例子:
假设我们正在计算各种品牌肥皂的成本,它们是值为 s(29, 28, 210, 28, 29) 的数字。
# Creating a Factor
soap_cost <- factor(c(29, 28, 210, 28, 29))

# Converting Factor to numeric
as.numeric(as.character(soap_cost))
输出:
[1] 29 28 210 28 29
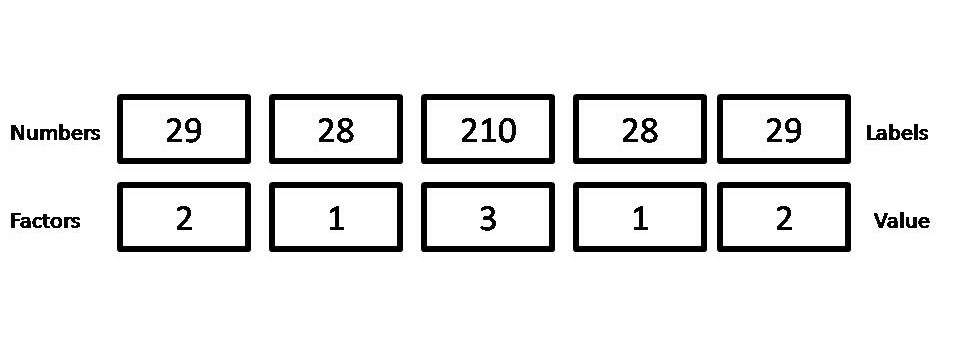
但是,如果你只是简单地使用 as。 numeric(),输出是因子的内部级别表示的向量,而不是原始值。
# Creating a Factor
soap_cost <- factor(c(29, 28, 210, 28, 29))

# Converting Factor to Numeric
as.numeric(soap_cost)
输出:
[1] 2 1 3 1 2
将数值转换为因子
为了将数字转换为因子,我们使用cut()函数。 cut()将要通过切割转换为区间的数字向量(假设 x)的范围划分并根据它们落在哪个区间对其值(x)进行编码。
一级对应于最左边,二级对应于下一个最左边,依此类推。
Syntax:
cut.default(x, breaks, labels = NULL, include.lowest = FALSE, right = TRUE, dig.lab = 3)
在哪里,
- 当通过 'break=' 参数给出一个数字时,输出因子是通过将变量范围划分为该数量的等长间隔来创建的。
- 在语法中 include.lowest 指示是否应包含等于最低(对于 right= TRUE)break 值的'x[i]'。语法中的“right”表示间隔是否应该在左侧打开并在右侧关闭,反之亦然。
- 如果未提供标签,则使用 dig.lab。用于格式化中断号的位数是通过它确定的。
示例 1:
让我们假设一个包含年龄、薪水和性别的员工数据集。要创建一个与年龄对应的具有三个等间距水平的因子,我们可以在 R 中编写如下:
# Creating vectors
age <- c(40, 49, 48, 40, 67, 52, 53)
salary <- c(103200, 106200, 150200, 10606, 10390, 14070, 10220)
gender <- c("male", "male", "transgender",
            "female", "male", "female", "transgender")

# Creating data frame named employee
employee<- data.frame(age, salary, gender)

# Creating a factor corresponding to age
# with three equally spaced levels
wfact = cut(employee$age, 3)
table(wfact)
输出:
wfact
(40,49] (49,58] (58,67]
      4       2       1
示例 2:
我们现在将贴上标签——年轻、中年和老年。
# Creating vectors
age <- c(40, 49, 48, 40, 67, 52, 53)
salary <- c(103200, 106200, 150200, 10606, 10390, 14070, 10220)
gender <- c("male", "male", "transgender",
            "female", "male", "female", "transgender")

# Creating data frame named employee
employee<- data.frame(age, salary, gender)

# Creating a factor corresponding to age with labels
wfact = cut(employee$age, 3, labels=c('Young', 'Medium', 'Aged'))
table(wfact)
输出:
wfact
 Young Medium   Aged
     4      2      1
下一个示例将使用“ norm() ”在指定空间内生成多元正态分布随机变量。
rnorm() 有三个参数:
- n:需要生成的随机变量个数
- mean:如果没有提到,默认为0
- sd:标准差值需要注明,否则默认为1
句法:
norm(n, mean, sd)# Generating a vector with random numbers
y <- rnorm(100)
# the output factor is created by the division
# of the range of variables into pi/3*(-3:3)
# 4 equal-length intervalsa
table(cut(y, breaks = pi/3*(-3:3)))
输出:
(-3.14,-2.09] (-2.09,-1.05]     (-1.05,0]      (0,1.05]   (1.05,2.09]
            1            11            26            48            10
  (2.09,3.14]
            4
通过 break 参数将变量范围划分为 5 个等长间隔来创建输出因子。
age <- c(40, 49, 48, 40, 67, 52, 53)
gender <- c("male", "male", "transgender", "female", "male", "female", "transgender")

# Data frame generated from the above vectors
employee<- data.frame(age, gender)

# the output factor is created by the division
# of the range of variables into 5 equal-length intervals
wfact = cut(employee$age, breaks=5)
table(wfact)
输出:
wfact
  (40,45.4] (45.4,50.8] (50.8,56.2] (56.2,61.6]   (61.6,67]
          2           2           2           0           1
y <- rnorm(100)
table(cut(y, breaks = pi/3*(-3:3), dig.lab=5))
输出:
(-3.1416,-2.0944] (-2.0944,-1.0472]       (-1.0472,0]        (0,1.0472]
                5                13                33                28
  (1.0472,2.0944]   (2.0944,3.1416]
               19                 2
在评论中写代码?请使用 ide.geeksforgeeks.org,生成链接并在此处分享链接。