Python中的 Matplotlib.colors.BoundaryNorm 类
Matplotlib是Python中用于数组二维图的惊人可视化库。 Matplotlib 是一个基于 NumPy 数组构建的多平台数据可视化库,旨在与更广泛的 SciPy 堆栈配合使用。
matplotlib.colors.BoundaryNorm
matplotlib.colors.BoundaryNorm类属于matplotlib.colors模块。 matplotlib.colors 模块用于将颜色或数字参数转换为 RGBA 或 RGB。此模块用于将数字映射到颜色或在一维颜色数组(也称为颜色图)中进行颜色规范转换。
matplotlib.colors.BoundaryNorm 类用于创建基于离散间隔的颜色图。 BoundaryNorm 将值映射到整数,不像 Normalize 或 LogNorm 映射到 0 到 1 的区间。分段线性插值可用于映射到 o 区间,但是,使用整数更简单,并且可以减少整数和浮点数之间的来回转换。
参数:
- 边界:它是一个类似数组的对象,单调增加边界序列
- ncolor :它接受一个整数值,该值表示将使用的颜色图中的多种颜色。
- clip :它接受一个布尔值并且是一个可选参数。如果剪辑为 True,则超出范围且低于边界 [0] 的值将映射到 0,而如果它们高于边界 [-1],则将它们映射到 ncolors-1。如果剪辑设置为 False,超出范围的值和它们低于边界 [0] 将映射到 -1,而如果它们高于边界 [-1],它们将映射到 ncolors。 Colormap.__call__() 将这些转换为有效索引。
注意: bin 的边缘由边界定义,并且 bin 内的数据映射到相同的颜色索引。如果 ncolors 不等于 bin 的数量,则使用线性插值来为它们选择颜色。
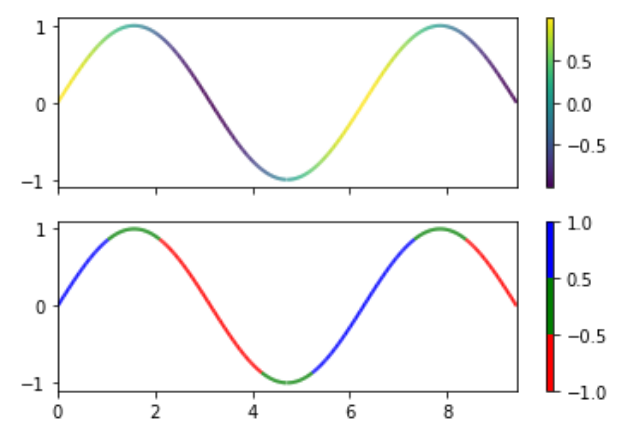
示例 1:
Python3
import numpy as np
import matplotlib.pyplot as plt
from matplotlib.collections import LineCollection
from matplotlib.colors import ListedColormap, BoundaryNorm

a = np.linspace(0, 3 * np.pi, 500)
b = np.sin(a)
# this is the first derivative
dbda = np.cos(0.5 * (a[:-1] + a[1:]))

# Creating  line segments so
# to color them individually
points = np.array([a, b]).T.reshape(-1, 1, 2)
set_of_segments = np.concatenate([points[:-1],
                                  points[1:]],
                                 axis = 1)

figure, axes = plt.subplots(2, 1,
                            sharex = True,
                            sharey = True)

# Mapping the data points with
# continuous norm
continuous_norm = plt.Normalize(dbda.min(),
                               dbda.max())

line_collection = LineCollection(set_of_segments,
                                 cmap ='viridis',
                                 norm = continuous_norm)

# Set the values used for
# colormapping
line_collection.set_array(dbda)
line_collection.set_linewidth(2)
line = axes[0].add_collection(line_collection)
figure.colorbar(line, ax = axes[0])

# Use a boundary norm instead
cmap = ListedColormap(['r', 'g', 'b'])
boundary_norm = BoundaryNorm([-1, -0.5, 0.5, 1],
                             cmap.N)

line_collection = LineCollection(set_of_segments,
                                 cmap = cmap,
                                 norm = boundary_norm)

line_collection.set_array(dbda)
line_collection.set_linewidth(2)
line = axes[1].add_collection(line_collection)
figure.colorbar(line, ax = axes[1])

axes[0].set_xlim(a.min(), a.max())
axes[0].set_ylim(-1.1, 1.1)
plt.show()
Python3
import numpy as np
import matplotlib as mpl
import matplotlib.pylab as plt
# setup the plot
figure, axes = plt.subplots(1, 1,
figsize=(6, 6))
# defining random data
x = np.random.rand(20)
y = np.random.rand(20)
tag = np.random.randint(0, 20, 20)
tag[10:12] = 0
# defining the colormap
cmap = plt.cm.jet
# extracting all colors
cmaplist = [cmap(i) for i in range(cmap.N)]
# making first color entry grey
cmaplist[0] = (.5, .5, .5, 1.0)
# new map
cmap = mpl.colors.LinearSegmentedColormap.from_list(
'Custom cmap', cmaplist, cmap.N)
# defining the bins and norms
bounds = np.linspace(0, 20, 21)
norm = mpl.colors.BoundaryNorm(bounds,
cmap.N)
# the scatter
scat = axes.scatter(x, y, c=tag,
s=np.random.randint(100,
500,
20),
cmap=cmap, norm=norm)
# axes for the colorbar
ax2 = figure.add_axes([0.95, 0.1,
0.03, 0.8])
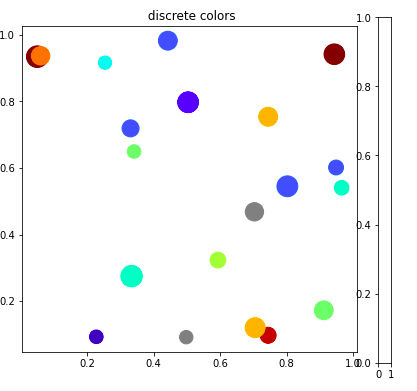
axes.set_title(' discrete colors')输出:
示例 2:
Python3
import numpy as np
import matplotlib as mpl
import matplotlib.pylab as plt


# setup the plot
figure, axes = plt.subplots(1, 1,
                            figsize=(6, 6))

# defining random data
x = np.random.rand(20)
y = np.random.rand(20)
tag = np.random.randint(0, 20, 20)
tag[10:12] = 0

# defining the colormap
cmap = plt.cm.jet

# extracting all colors
cmaplist = [cmap(i) for i in range(cmap.N)]

# making first color entry  grey
cmaplist[0] = (.5, .5, .5, 1.0)

# new map
cmap = mpl.colors.LinearSegmentedColormap.from_list(
   'Custom cmap', cmaplist, cmap.N)

# defining the bins and norms
bounds = np.linspace(0, 20, 21)
norm = mpl.colors.BoundaryNorm(bounds,
                               cmap.N)

# the scatter
scat = axes.scatter(x, y, c=tag,
                    s=np.random.randint(100,
                                        500,
                                        20),
                    cmap=cmap, norm=norm)

# axes for the colorbar
ax2 = figure.add_axes([0.95, 0.1,
                       0.03, 0.8])


axes.set_title(' discrete colors')
输出: