在Python使用 Excel 电子表格
你们一定在生活中的某个时候使用过 Excel,并且一定觉得需要自动化一些重复或乏味的任务。别担心,在本教程中,我们将学习如何使用Python处理 Excel,或使用Python自动化 Excel。我们将在 Openpyxl 模块的帮助下进行介绍。
入门
Openpyxl是一个Python库,它提供了各种使用Python与 Excel 文件交互的方法。它允许诸如读、写、算术运算、绘制图形等操作。
该模块不是内置于Python的。要安装此类型,请在终端中输入以下命令。
pip install openpyxl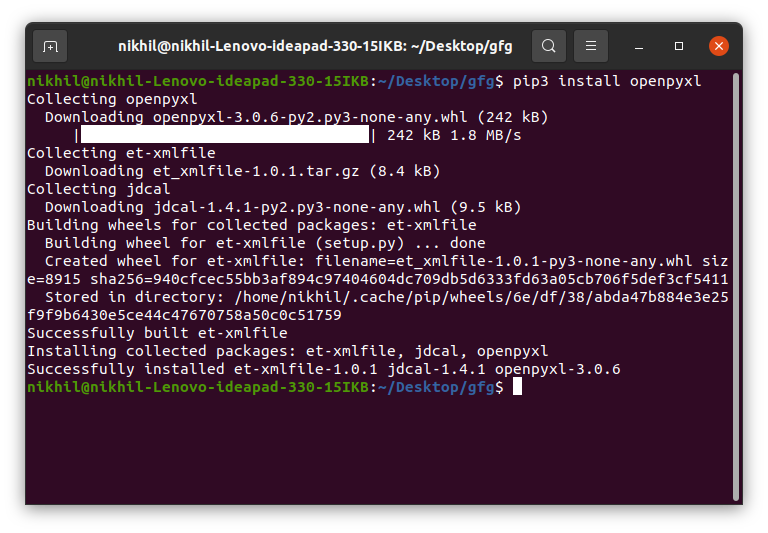
从电子表格中读取
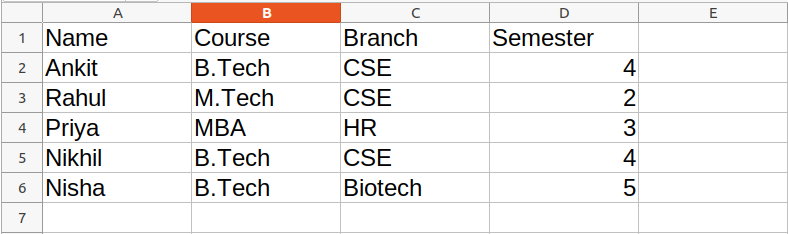
要读取 Excel 文件,您必须使用load_workbook()方法打开电子表格。之后,您可以使用active选择第一个可用的工作表,并通过传递 row 和 column 参数使用cell属性来选择单元格。 value属性打印特定单元格的值。请参阅下面的示例以获得更好的理解。
注意:第一行或第一列整数是 1,而不是 0。
使用的数据集:可以从这里下载。
例子:
Python3
# Python program to read an excel file

# import openpyxl module
import openpyxl

# Give the location of the file
path = "gfg.xlsx"

# To open the workbook
# workbook object is created
wb_obj = openpyxl.load_workbook(path)

# Get workbook active sheet object
# from the active attribute
sheet_obj = wb_obj.active

# Cell objects also have a row, column,
# and coordinate attributes that provide
# location information for the cell.

# Note: The first row or
# column integer is 1, not 0.

# Cell object is created by using
# sheet object's cell() method.
cell_obj = sheet_obj.cell(row = 1, column = 1)

# Print value of cell object
# using the value attribute
print(cell_obj.value)
Python3
# Python program to read an excel file

# import openpyxl module
import openpyxl

# Give the location of the file
path = "gfg.xlsx"

# To open the workbook
# workbook object is created
wb_obj = openpyxl.load_workbook(path)

# Get workbook active sheet object
# from the active attribute
sheet_obj = wb_obj.active

# Getting the value of maximum rows
# and column
row = sheet_obj.max_row
column = sheet_obj.max_column

print("Total Rows:", row)
print("Total Columns:", column)

# printing the value of first column
# Loop will print all values
# of first column
print("\nValue of first column")
for i in range(1, row + 1):
    cell_obj = sheet_obj.cell(row = i, column = 1)
    print(cell_obj.value)

# printing the value of first column
# Loop will print all values
# of first row
print("\nValue of first row")
for i in range(1, column + 1):
    cell_obj = sheet_obj.cell(row = 2, column = i)
    print(cell_obj.value, end = " ")
Python3
# Python program to read an excel file

# import openpyxl module
import openpyxl

# Give the location of the file
path = "gfg.xlsx"

# To open the workbook
# workbook object is created
wb_obj = openpyxl.load_workbook(path)

# Get workbook active sheet object
# from the active attribute
sheet_obj = wb_obj.active

# Cell object is created by using
# sheet object's cell() method.
cell_obj = sheet_obj['A1': 'B6']

# Print value of cell object
# using the value attribute
for cell1, cell2 in cell_obj:
    print(cell1.value, cell2.value)
Python3
from openpyxl import Workbook

# Call a Workbook() function of openpyxl
# to create a new blank Workbook object
workbook = Workbook()

# Anytime you modify the Workbook object
# or its sheets and cells, the spreadsheet
# file will not be saved until you call
# the save() workbook method.
workbook.save(filename="sample.xlsx")
Python3
# import openpyxl module
import openpyxl

# Call a Workbook() function of openpyxl
# to create a new blank Workbook object
wb = openpyxl.Workbook()

# Get workbook active sheet
# from the active attribute
sheet = wb.active

# Cell objects also have row, column
# and coordinate attributes that provide
# location information for the cell.

# Note: The first row or column integer
# is 1, not 0. Cell object is created by
# using sheet object's cell() method.
c1 = sheet.cell(row = 1, column = 1)

# writing values to cells
c1.value = "Hello"

c2 = sheet.cell(row= 1 , column = 2)
c2.value = "World"

# Once have a Worksheet object, one can
# access a cell object by its name also.
# A2 means column = 1 & row = 2.
c3 = sheet['A2']
c3.value = "Welcome"

# B2 means column = 2 & row = 2.
c4 = sheet['B2']
c4.value = "Everyone"

# Anytime you modify the Workbook object
# or its sheets and cells, the spreadsheet
# file will not be saved until you call
# the save() workbook method.
wb.save("sample.xlsx")
Python3
# import openpyxl module
import openpyxl

wb = openpyxl.load_workbook("sample.xlsx")

sheet = wb.active

c = sheet['A3']
c.value = "New Data"

wb.save("sample.xlsx")
Python3
# import openpyxl module
import openpyxl

wb = openpyxl.load_workbook("sample.xlsx")

sheet = wb.active

data = (
    (1, 2, 3),
    (4, 5, 6)
)

for row in data:
    sheet.append(row)

wb.save('sample.xlsx')
Python3
# import openpyxl module
import openpyxl

# Call a Workbook() function of openpyxl
# to create a new blank Workbook object
wb = openpyxl.Workbook()

# Get workbook active sheet
# from the active attribute.
sheet = wb.active

# writing to the cell of an excel sheet
sheet['A1'] = 200
sheet['A2'] = 300
sheet['A3'] = 400
sheet['A4'] = 500
sheet['A5'] = 600

# The value in cell A7 is set to a formula
# that sums the values in A1, A2, A3, A4, A5 .
sheet['A7'] = '= SUM(A1:A5)'

# save the file
wb.save("sum.xlsx")
Python3
# import openpyxl module
import openpyxl

# Call a Workbook() function of openpyxl
# to create a new blank Workbook object
wb = openpyxl.Workbook()

# Get workbook active sheet
# from the active attribute.
sheet = wb.active

# writing to the specified cell
sheet.cell(row = 1, column = 1).value = ' hello '

sheet.cell(row = 2, column = 2).value = ' everyone '

# set the height of the row
sheet.row_dimensions[1].height = 70

# set the width of the column
sheet.column_dimensions['B'].width = 20

# save the file
wb.save('sample.xlsx')
Python3
import openpyxl
wb = openpyxl.Workbook()
sheet = wb.active

# merge cell from A2 to D4 i.e.
# A2, B2, C2, D2, A3, B3, C3, D3, A4, B4, C4 and D4 .
# A2:D4' merges 12 cells into a single cell.
sheet.merge_cells('A2:D4')

sheet.cell(row = 2, column = 1).value = 'Twelve cells join together.'

# merge cell C6 and D6
sheet.merge_cells('C6:D6')

sheet.cell(row = 6, column = 6).value = 'Two merge cells.'

wb.save('sample.xlsx')
Python3
import openpyxl


wb = openpyxl.load_workbook('sample.xlsx')
sheet = wb.active

# unmerge the cells
sheet.unmerge_cells('A2:D4')

sheet.unmerge_cells('C6:D6')

wb.save('sample.xlsx')
Python3
import openpyxl

# import Font function from openpyxl
from openpyxl.styles import Font


wb = openpyxl.Workbook()
sheet = wb.active

sheet.cell(row = 1, column = 1).value = "GeeksforGeeks"

# set the size of the cell to 24
sheet.cell(row = 1, column = 1).font = Font(size = 24 )

sheet.cell(row = 2, column = 2).value = "GeeksforGeeks"

# set the font style to italic
sheet.cell(row = 2, column = 2).font = Font(size = 24, italic = True)

sheet.cell(row = 3, column = 3).value = "GeeksforGeeks"

# set the font style to bold
sheet.cell(row = 3, column = 3).font = Font(size = 24, bold = True)

sheet.cell(row = 4, column = 4).value = "GeeksforGeeks"

# set the font name to 'Times New Roman'
sheet.cell(row = 4, column = 4).font = Font(size = 24, name = 'Times New Roman')

wb.save('sample.xlsx')
Python3
# import openpyxl module
import openpyxl

# import BarChart class from openpyxl.chart sub_module
from openpyxl.chart import BarChart, Reference

# Call a Workbook() function of openpyxl
# to create a new blank Workbook object
wb = openpyxl.Workbook()

# Get workbook active sheet
# from the active attribute.
sheet = wb.active

# write o to 9 in 1st column of the active sheet
for i in range(10):
    sheet.append([i])

# create data for plotting
values = Reference(sheet, min_col=1, min_row=1,
                   max_col=1, max_row=10)

# Create object of BarChart class
chart = BarChart()

# adding data to the Bar chart object
chart.add_data(values)

# set the title of the chart
chart.title = " BAR-CHART "

# set the title of the x-axis
chart.x_axis.title = " X_AXIS "

# set the title of the y-axis
chart.y_axis.title = " Y_AXIS "

# add chart to the sheet
# the top-left corner of a chart
# is anchored to cell E2 .
sheet.add_chart(chart, "E2")

# save the file
wb.save("sample.xlsx")
Python3
# import openpyxl module
import openpyxl
# import LineChart class from openpyxl.chart sub_module
from openpyxl.chart import LineChart, Reference
wb = openpyxl.Workbook()
sheet = wb.active
# write o to 9 in 1st column of the active sheet
for i in range(10):
sheet.append([i])
values = Reference(sheet, min_col=1, min_row=1,
max_col=1, max_row=10)
# Create object of LineChart class
chart = LineChart()
chart.add_data(values)
# set the title of the chart
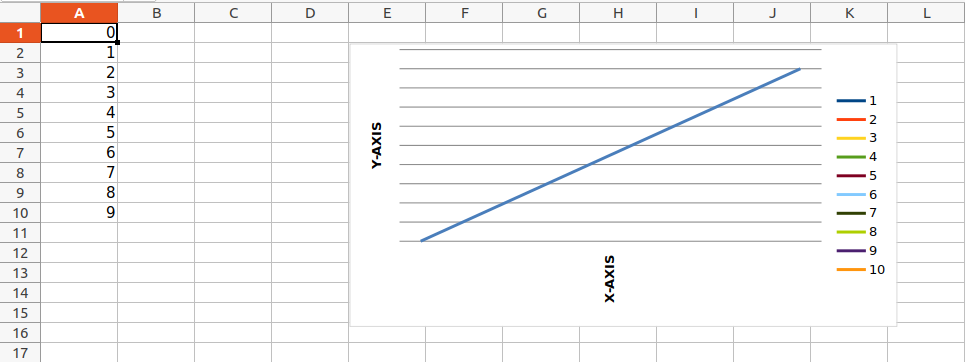
chart.title = " LINE-CHART "
# set the title of the x-axis
chart.x_axis.title = " X-AXIS "
# set the title of the y-axis
chart.y_axis.title = " Y-AXIS "
# add chart to the sheet
# the top-left corner of a chart
# is anchored to cell E2 .
sheet.add_chart(chart, "E2")
# save the file
wb.save("sample.xlsx")Python3
import openpyxl
from openpyxl.drawing.image import Image

wb = openpyxl.Workbook()

sheet = wb.active

# Adding a row of data to the worksheet (used to
# distinguish previous excel data from the image)
sheet.append([10, 2010, "Geeks", 4, "life"])

# A wrapper over PIL.Image, used to provide image
# inclusion properties to openpyxl library
img = Image("geek.jpg")

# Adding the image to the worksheet
# (with attributes like position)
sheet.add_image(img, 'A2')

# Saving the workbook created
wb.save('sample.xlsx')
输出:
Name从多个单元格读取
从多个单元格中读取数据的方式有两种。
方法一:我们可以分别使用max_row和max_column来获取总行数和总列数。我们可以在 for 循环中使用这些值来根据情况获取所需行或列或任何单元格的值。让我们看看如何获取第一列和第一行的值。
例子:
蟒蛇3
# Python program to read an excel file

# import openpyxl module
import openpyxl

# Give the location of the file
path = "gfg.xlsx"

# To open the workbook
# workbook object is created
wb_obj = openpyxl.load_workbook(path)

# Get workbook active sheet object
# from the active attribute
sheet_obj = wb_obj.active

# Getting the value of maximum rows
# and column
row = sheet_obj.max_row
column = sheet_obj.max_column

print("Total Rows:", row)
print("Total Columns:", column)

# printing the value of first column
# Loop will print all values
# of first column
print("\nValue of first column")
for i in range(1, row + 1):
    cell_obj = sheet_obj.cell(row = i, column = 1)
    print(cell_obj.value)

# printing the value of first column
# Loop will print all values
# of first row
print("\nValue of first row")
for i in range(1, column + 1):
    cell_obj = sheet_obj.cell(row = 2, column = i)
    print(cell_obj.value, end = " ")
输出:
Total Rows: 6
Total Columns: 4

Value of first column
Name
Ankit
Rahul
Priya
Nikhil
Nisha

Value of first row
Ankit B.Tech CSE 4 方法二:我们也可以使用单元格名称从多个单元格中读取。这可以看作是Python的列表切片。
蟒蛇3
# Python program to read an excel file

# import openpyxl module
import openpyxl

# Give the location of the file
path = "gfg.xlsx"

# To open the workbook
# workbook object is created
wb_obj = openpyxl.load_workbook(path)

# Get workbook active sheet object
# from the active attribute
sheet_obj = wb_obj.active

# Cell object is created by using
# sheet object's cell() method.
cell_obj = sheet_obj['A1': 'B6']

# Print value of cell object
# using the value attribute
for cell1, cell2 in cell_obj:
    print(cell1.value, cell2.value)
输出:
Name Course
Ankit  B.Tech
Rahul M.Tech
Priya MBA
Nikhil B.Tech
Nisha B.Tech
请参阅以下文章以获取有关使用 openpyxl 读取 excel 文件的详细信息。
- 使用Python openpyxl 模块读取 excel 文件
写入电子表格
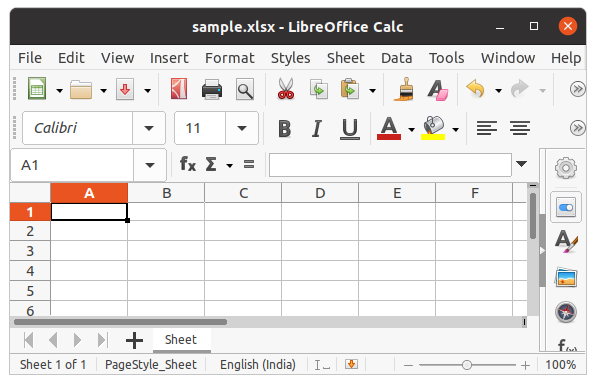
首先,让我们创建一个新的电子表格,然后我们将一些数据写入新创建的文件。可以使用Workbook()方法创建一个空的电子表格。让我们看看下面的例子。
例子:
蟒蛇3
from openpyxl import Workbook

# Call a Workbook() function of openpyxl
# to create a new blank Workbook object
workbook = Workbook()

# Anytime you modify the Workbook object
# or its sheets and cells, the spreadsheet
# file will not be saved until you call
# the save() workbook method.
workbook.save(filename="sample.xlsx")
输出:
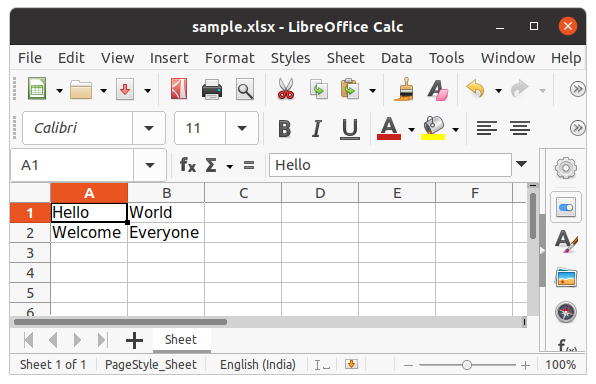
创建一个空文件后,让我们看看如何使用Python向其中添加一些数据。要首先添加数据,我们需要选择活动工作表,然后使用 cell() 方法,我们可以通过传递行号和列号作为其参数来选择任何特定的单元格。我们也可以使用单元格名称进行书写。请参阅下面的示例以更好地理解。
例子:
蟒蛇3
# import openpyxl module
import openpyxl

# Call a Workbook() function of openpyxl
# to create a new blank Workbook object
wb = openpyxl.Workbook()

# Get workbook active sheet
# from the active attribute
sheet = wb.active

# Cell objects also have row, column
# and coordinate attributes that provide
# location information for the cell.

# Note: The first row or column integer
# is 1, not 0. Cell object is created by
# using sheet object's cell() method.
c1 = sheet.cell(row = 1, column = 1)

# writing values to cells
c1.value = "Hello"

c2 = sheet.cell(row= 1 , column = 2)
c2.value = "World"

# Once have a Worksheet object, one can
# access a cell object by its name also.
# A2 means column = 1 & row = 2.
c3 = sheet['A2']
c3.value = "Welcome"

# B2 means column = 2 & row = 2.
c4 = sheet['B2']
c4.value = "Everyone"

# Anytime you modify the Workbook object
# or its sheets and cells, the spreadsheet
# file will not be saved until you call
# the save() workbook method.
wb.save("sample.xlsx")
输出:
请参阅以下文章以获取有关写入 Excel 的详细信息。
- 使用 openpyxl 模块写入 excel 文件
附加到电子表格
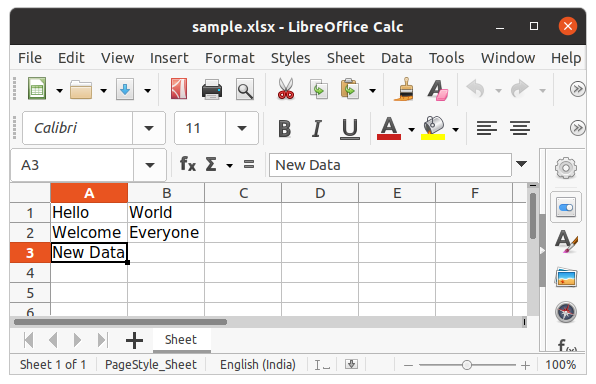
在上面的示例中,您将看到每次尝试写入电子表格时,现有数据都会被覆盖,并且该文件将另存为新文件。发生这种情况是因为Workbook()方法总是创建一个新的工作簿文件对象。要写入现有工作簿,您必须使用load_workbook()方法打开文件。我们将使用上面创建的工作簿。
例子:
蟒蛇3
# import openpyxl module
import openpyxl

wb = openpyxl.load_workbook("sample.xlsx")

sheet = wb.active

c = sheet['A3']
c.value = "New Data"

wb.save("sample.xlsx")
输出:
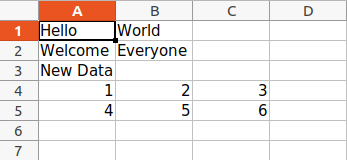
我们还可以使用append()方法在工作表末尾附加多个数据。
例子:
蟒蛇3
# import openpyxl module
import openpyxl

wb = openpyxl.load_workbook("sample.xlsx")

sheet = wb.active

data = (
    (1, 2, 3),
    (4, 5, 6)
)

for row in data:
    sheet.append(row)

wb.save('sample.xlsx')
输出:
电子表格上的算术运算
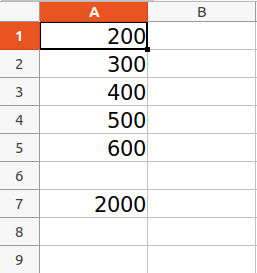
可以通过在电子表格的特定单元格中键入公式来执行算术运算。例如,如果我们想找到总和,则使用 excel 文件的=Sum()公式。
例子:
蟒蛇3
# import openpyxl module
import openpyxl

# Call a Workbook() function of openpyxl
# to create a new blank Workbook object
wb = openpyxl.Workbook()

# Get workbook active sheet
# from the active attribute.
sheet = wb.active

# writing to the cell of an excel sheet
sheet['A1'] = 200
sheet['A2'] = 300
sheet['A3'] = 400
sheet['A4'] = 500
sheet['A5'] = 600

# The value in cell A7 is set to a formula
# that sums the values in A1, A2, A3, A4, A5 .
sheet['A7'] = '= SUM(A1:A5)'

# save the file
wb.save("sum.xlsx")
输出:
请参阅以下文章以获取有关电子表格算术运算的详细信息。
- 使用openpyxl在excel文件中进行算术运算
调整行列
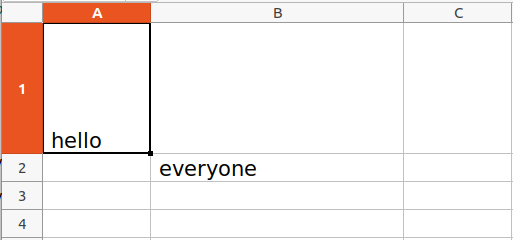
工作表对象具有控制行高和列宽的 row_dimensions 和 column_dimensions 属性。工作表的 row_dimensions 和 column_dimensions 是类似字典的值; row_dimensions 包含 RowDimension 对象, column_dimensions 包含 ColumnDimension 对象。在 row_dimensions 中,可以使用行号(在本例中为 1 或 2)访问其中一个对象。在 column_dimensions 中,可以使用列的字母(在本例中为 A 或 B)访问其中一个对象。
例子:
蟒蛇3
# import openpyxl module
import openpyxl

# Call a Workbook() function of openpyxl
# to create a new blank Workbook object
wb = openpyxl.Workbook()

# Get workbook active sheet
# from the active attribute.
sheet = wb.active

# writing to the specified cell
sheet.cell(row = 1, column = 1).value = ' hello '

sheet.cell(row = 2, column = 2).value = ' everyone '

# set the height of the row
sheet.row_dimensions[1].height = 70

# set the width of the column
sheet.column_dimensions['B'].width = 20

# save the file
wb.save('sample.xlsx')
输出:
合并单元格
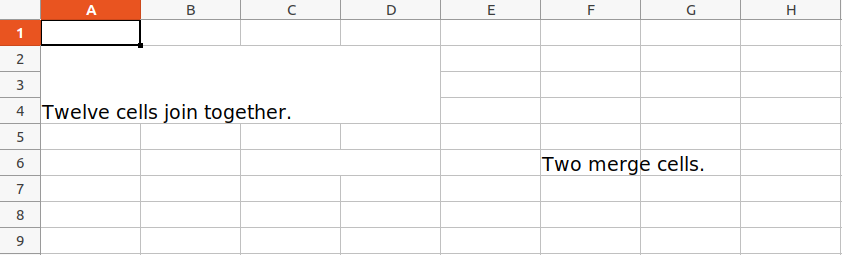
可以使用 merge_cells() 表单方法将矩形区域的单元格合并为单个单元格。 merge_cells() 的参数是要合并的矩形区域的左上角和右下角单元格的单个字符串。
例子:
蟒蛇3
import openpyxl
wb = openpyxl.Workbook()
sheet = wb.active

# merge cell from A2 to D4 i.e.
# A2, B2, C2, D2, A3, B3, C3, D3, A4, B4, C4 and D4 .
# A2:D4' merges 12 cells into a single cell.
sheet.merge_cells('A2:D4')

sheet.cell(row = 2, column = 1).value = 'Twelve cells join together.'

# merge cell C6 and D6
sheet.merge_cells('C6:D6')

sheet.cell(row = 6, column = 6).value = 'Two merge cells.'

wb.save('sample.xlsx')
输出:
取消合并单元格
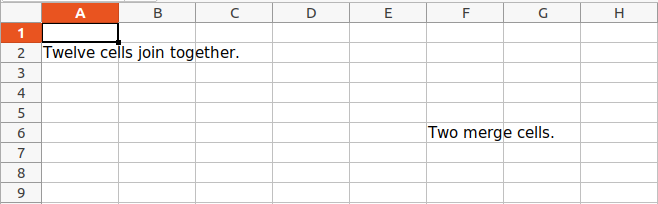
要取消合并单元格,请调用 unmerge_cells() 工作表方法。
例子:
蟒蛇3
import openpyxl


wb = openpyxl.load_workbook('sample.xlsx')
sheet = wb.active

# unmerge the cells
sheet.unmerge_cells('A2:D4')

sheet.unmerge_cells('C6:D6')

wb.save('sample.xlsx')
输出:
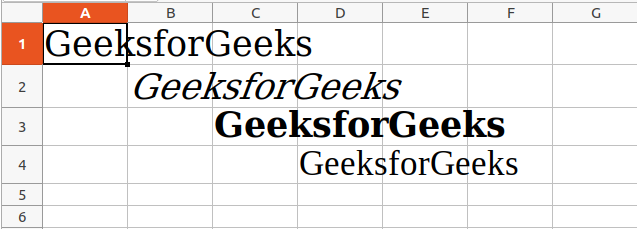
设置字体样式
要自定义单元格中的字体样式,重要的是从openpyxl.styles模块导入Font()函数。
例子:
蟒蛇3
import openpyxl

# import Font function from openpyxl
from openpyxl.styles import Font


wb = openpyxl.Workbook()
sheet = wb.active

sheet.cell(row = 1, column = 1).value = "GeeksforGeeks"

# set the size of the cell to 24
sheet.cell(row = 1, column = 1).font = Font(size = 24 )

sheet.cell(row = 2, column = 2).value = "GeeksforGeeks"

# set the font style to italic
sheet.cell(row = 2, column = 2).font = Font(size = 24, italic = True)

sheet.cell(row = 3, column = 3).value = "GeeksforGeeks"

# set the font style to bold
sheet.cell(row = 3, column = 3).font = Font(size = 24, bold = True)

sheet.cell(row = 4, column = 4).value = "GeeksforGeeks"

# set the font name to 'Times New Roman'
sheet.cell(row = 4, column = 4).font = Font(size = 24, name = 'Times New Roman')

wb.save('sample.xlsx')
输出:
请参阅以下文章以获取有关调整行和列的详细信息。
- 使用 openpyxl 模块调整 Excel 文件的行和列
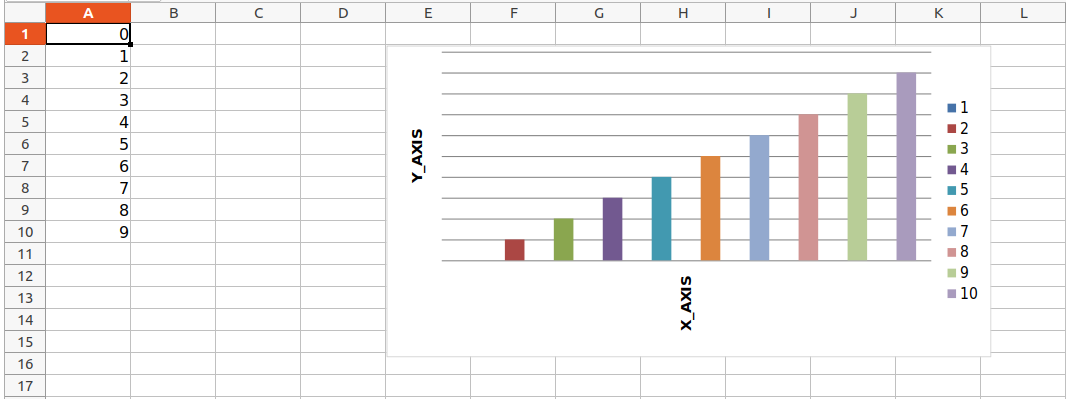
绘制图表
图表由至少一系列的一个或多个数据点组成。系列本身由对单元格范围的引用组成。要在 Excel 表格上绘制图表,首先要创建特定图表类(即 BarChart、LineChart 等)的图表对象。创建图表对象后,在其中插入数据,最后将该图表对象添加到工作表对象中。
示例 1:
蟒蛇3
# import openpyxl module
import openpyxl

# import BarChart class from openpyxl.chart sub_module
from openpyxl.chart import BarChart, Reference

# Call a Workbook() function of openpyxl
# to create a new blank Workbook object
wb = openpyxl.Workbook()

# Get workbook active sheet
# from the active attribute.
sheet = wb.active

# write o to 9 in 1st column of the active sheet
for i in range(10):
    sheet.append([i])

# create data for plotting
values = Reference(sheet, min_col=1, min_row=1,
                   max_col=1, max_row=10)

# Create object of BarChart class
chart = BarChart()

# adding data to the Bar chart object
chart.add_data(values)

# set the title of the chart
chart.title = " BAR-CHART "

# set the title of the x-axis
chart.x_axis.title = " X_AXIS "

# set the title of the y-axis
chart.y_axis.title = " Y_AXIS "

# add chart to the sheet
# the top-left corner of a chart
# is anchored to cell E2 .
sheet.add_chart(chart, "E2")

# save the file
wb.save("sample.xlsx")
输出:
示例 2:
蟒蛇3
# import openpyxl module
import openpyxl

# import LineChart class from openpyxl.chart sub_module
from openpyxl.chart import LineChart, Reference

wb = openpyxl.Workbook()
sheet = wb.active

# write o to 9 in 1st column of the active sheet
for i in range(10):
    sheet.append([i])

values = Reference(sheet, min_col=1, min_row=1,
                   max_col=1, max_row=10)

# Create object of LineChart class
chart = LineChart()

chart.add_data(values)

# set the title of the chart
chart.title = " LINE-CHART "

# set the title of the x-axis
chart.x_axis.title = " X-AXIS "

# set the title of the y-axis
chart.y_axis.title = " Y-AXIS "

# add chart to the sheet
# the top-left corner of a chart
# is anchored to cell E2 .
sheet.add_chart(chart, "E2")

# save the file
wb.save("sample.xlsx")
输出:
请参阅以下文章以获取有关使用Python在 excel 中绘图的详细信息。
- 使用openpyxl 模块在excel 表中绘制图表|设置 1
- 使用openpyxl 模块在excel 表中绘制图表| 2套
- 使用openpyxl 模块在excel 表中绘制图表|设置 3
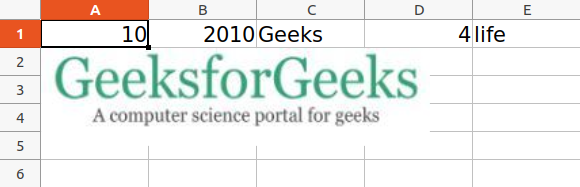
添加图像
为了在我们的工作表中导入图像,我们将使用openpyxl.drawing.image.Image。该方法是在 PIL(枕头)库中找到的 PIL.Image 方法的包装器。因此,必须安装 PIL(枕头)库才能使用此方法。
使用的图像:

例子:
蟒蛇3
import openpyxl
from openpyxl.drawing.image import Image

wb = openpyxl.Workbook()

sheet = wb.active

# Adding a row of data to the worksheet (used to
# distinguish previous excel data from the image)
sheet.append([10, 2010, "Geeks", 4, "life"])

# A wrapper over PIL.Image, used to provide image
# inclusion properties to openpyxl library
img = Image("geek.jpg")

# Adding the image to the worksheet
# (with attributes like position)
sheet.add_image(img, 'A2')

# Saving the workbook created
wb.save('sample.xlsx')
输出:
请参阅以下文章以获取有关添加图像的详细信息。
- Openpyxl - 添加图像
使用Python的 Excel 的更多功能
- 如何使用Openpyxl删除excel中的一行或多行?
- 使用openpyxl在excel文件中进行三角运算
- 如何将数据从一个excel表复制到另一个
- 如何在Python自动化 Excel 工作表?