Python OpenCV – cv2.calcHist 方法
OpenCV为我们提供了cv2.calcHist()函数来计算图像直方图。我们可以应用它来计算图像的组成颜色通道(蓝色、绿色和红色)的直方图。当我们使用cv2.imread()方法读取图像时,读取的图像是 BGR 格式。我们可以对cv2.calcHist()函数使用以下语法。
cv2.calcHist()函数:
Syntax: cv2.calcHist(images, channels, mask, histSize, ranges[, hist[, accumulate]])
Parameters:
- images: list of images as numpy arrays. All images must be of the same dtype and same size.
- channels: list of the channels used to calculate the histograms.
- mask: optional mask (8 bit array) of the same size as the input image.
- histSize: histogram sizes in each dimension
- ranges: Array of the dims arrays of the histogram bin boundaries in each dimension
- hist: Output histogram
- accumulate: accumulation flag, enables to compute a single histogram from several sets of arrays.
Return: It returns an array of histogram points of dtype float32.
让我们借助一些Python示例来了解cv2.calcHist()函数。
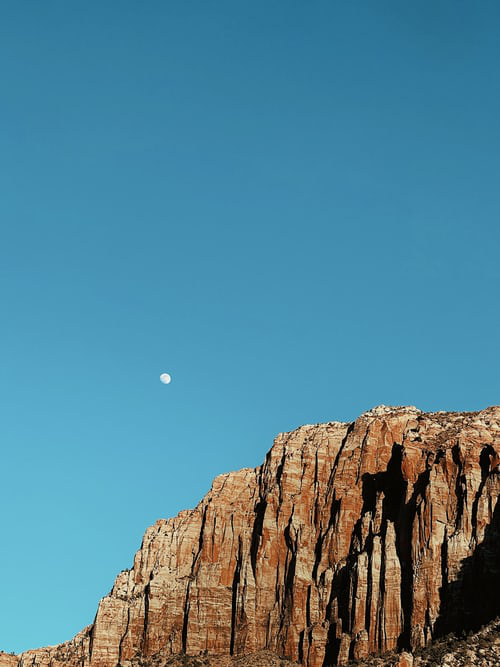
在下面的示例中,下图用作输入图像。
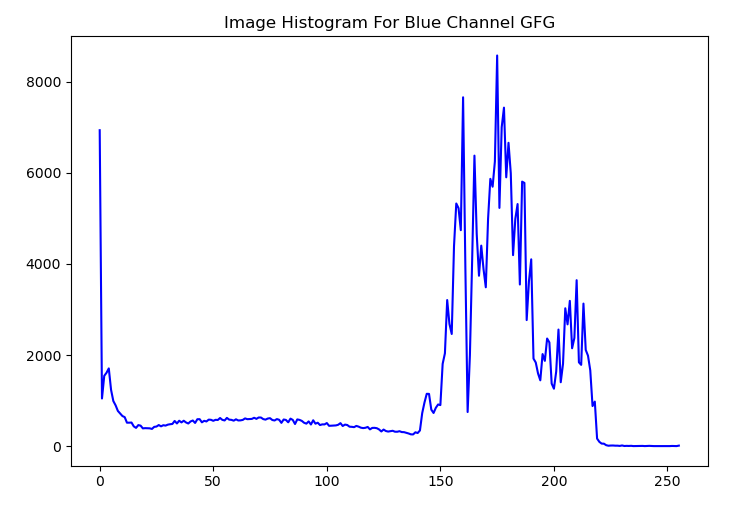
示例 1:
在本例中,我们使用cv2.calcHist()函数计算输入图像“mountain.jpg”的蓝色通道的直方图。我们通过参数 channels = [0] 来计算蓝色通道的直方图。我们还使用 Matplotlib 绘制直方图。
Python3
# Python program to compute and visualize the
# histogram of Blue channel of image
%matplotlib inline

# importing libraries
import cv2
import numpy as np
from matplotlib import pyplot as plt

# reading the input image
img = cv2.imread('mountain.jpg')

# computing the histogram of the blue channel of the image
hist = cv2.calcHist([img],[0],None,[256],[0,256])

# plot the above computed histogram
plt.plot(hist, color='b')
plt.title('Image Histogram For Blue Channel GFG')
plt.show()
Python3
# Python program to compute and visualize the
# histogram of Green channel of image
%matplotlib inline

# importing libraries
import cv2
import numpy as np
from matplotlib import pyplot as plt

# reading the input image
img = cv2.imread('mountain.jpg')

# computing the histogram of the green channel of the image
hist = cv2.calcHist([img],[1],None,[256],[0,256])

# plot the above computed histogram
plt.plot(hist, color='g')
plt.title('Image Histogram For Green Channel GFG')
plt.show()
Python3
# Python program to compute and visualize the
# histogram of Red channel of image
%matplotlib inline

# importing libraries
import cv2
import numpy as np
from matplotlib import pyplot as plt

# reading the input image
img = cv2.imread('mountain.jpg')

# computing the histogram of the Red channel of the image
hist = cv2.calcHist([img],[2],None,[256],[0,256])

# plot the above computed histogram
plt.plot(hist, color='r')
plt.title('Image Histogram For Red Channel GFG')
plt.show()
Python3
# Python program to compute and visualize the
# histogram of image for all three channels
%matplotlib inline

# importing libraries
import cv2
import numpy as np
from matplotlib import pyplot as plt

# reading the input image
img = cv2.imread('mountain.jpg')

# define colors to plot the histograms
colors = ('b','g','r')

# compute and plot the image histograms
for i,color in enumerate(colors):
    hist = cv2.calcHist([img],[i],None,[256],[0,256])
    plt.plot(hist,color = color)
plt.title('Image Histogram GFG')
plt.show()
输出:
示例 2:
在本例中,我们使用cv2.calcHist()函数计算输入图像“ mountain.jpg ”的绿色通道的直方图。我们通过参数 channels = [1] 来计算绿色通道的直方图。我们还使用 Matplotlib 绘制直方图。
Python3
# Python program to compute and visualize the
# histogram of Green channel of image
%matplotlib inline

# importing libraries
import cv2
import numpy as np
from matplotlib import pyplot as plt

# reading the input image
img = cv2.imread('mountain.jpg')

# computing the histogram of the green channel of the image
hist = cv2.calcHist([img],[1],None,[256],[0,256])

# plot the above computed histogram
plt.plot(hist, color='g')
plt.title('Image Histogram For Green Channel GFG')
plt.show()
输出:

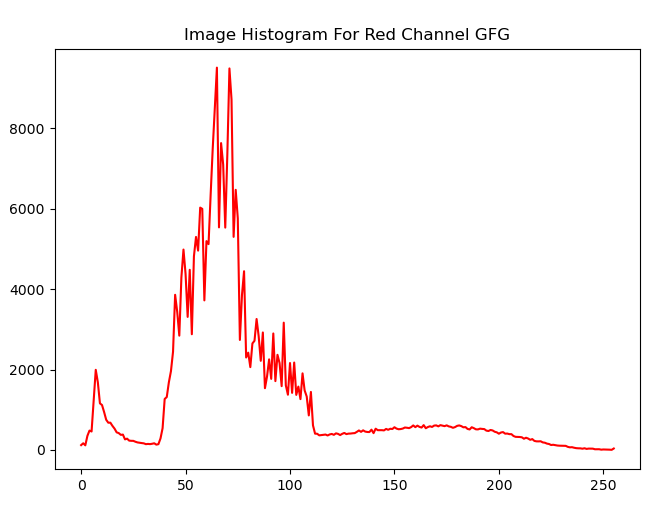
示例 3:
在本例中,我们使用 cv2.calcHist()函数计算输入图像“mountain.jpg”的红色通道的直方图。我们通过参数 channels = [2] 来计算红色通道的直方图。我们还使用 Matplotlib 绘制直方图。
Python3
# Python program to compute and visualize the
# histogram of Red channel of image
%matplotlib inline

# importing libraries
import cv2
import numpy as np
from matplotlib import pyplot as plt

# reading the input image
img = cv2.imread('mountain.jpg')

# computing the histogram of the Red channel of the image
hist = cv2.calcHist([img],[2],None,[256],[0,256])

# plot the above computed histogram
plt.plot(hist, color='r')
plt.title('Image Histogram For Red Channel GFG')
plt.show()
输出:
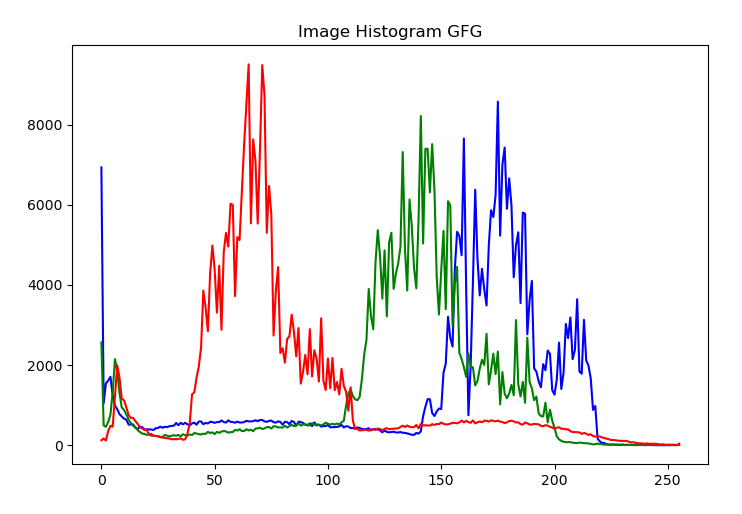
示例 4:
在本例中,我们使用 cv2.calcHist()函数计算输入图像“mountain.jpg”的所有三个颜色通道的直方图。我们使用for 循环遍历所有三个颜色通道。我们还使用 Matplotlib 绘制直方图。
Python3
# Python program to compute and visualize the
# histogram of image for all three channels
%matplotlib inline

# importing libraries
import cv2
import numpy as np
from matplotlib import pyplot as plt

# reading the input image
img = cv2.imread('mountain.jpg')

# define colors to plot the histograms
colors = ('b','g','r')

# compute and plot the image histograms
for i,color in enumerate(colors):
    hist = cv2.calcHist([img],[i],None,[256],[0,256])
    plt.plot(hist,color = color)
plt.title('Image Histogram GFG')
plt.show()
输出: