R中的缩放变量平行坐标图
要分析和可视化高维数据,可以使用平行坐标。背景由 n 条平行线组成,通常垂直且间隔均匀,以显示 n 维空间中的一组点。 n维空间中的一个点由一条多段线表示,其顶点位于平行轴上;该点的第 i个坐标对应于顶点在第 i个轴上的位置。
R 编程语言中的缩放变量平行坐标图
这种表示类似于时间序列可视化,除了它用于没有自然顺序的数据,因为轴与时间点不相关。因此,可能对几个轴布局感兴趣。
使用的模块:
- GGally:它通过添加几个函数来扩展 ggplot2,以降低将几何图形与转换数据组合的复杂性。可以使用以下命令安装它:
install.packages("GGally")- hrbrthemes:它是轴和绘图的额外“ggplot2”主题的汇编。
install.packages("hrbrthemes")要绘制平行坐标,我们将使用 ggparcoord() 方法。
Syntax: ggparcoord( data, columns = 1:ncol(data), groupColumn = NULL, scale = “std”, scaleSummary = “mean”, centerObsID = 1, missing = “exclude”, order = columns, showPoints = FALSE, splineFactor = FALSE, alphaLines = 1, boxplot = FALSE, shadeBox = NULL, mapping = NULL, title = “”)
Parameters:
- data: Dataset
- columns: Vector of variables (either names or indices) to be axes in the plot
- groupColumn: Single variable to group (color) by
- scale: Method used to scale the variables (see Details)
- scaleSummary: if scale==”center”, summary statistic to univariately center each variable by
- centerObsID: if scale==”centerObs”, row number of case plot should univariately be centered on
- missing: Method used to handle missing values (see Details)
- order: Method used to order the axes (see Details)
- showPoints: logical operator indicating whether points should be plotted or not
示例 1:没有缩放
在这里,我们将看到不使用缩放变量。为此,我们不会使用比例属性。
R
# Libraries
library(GGally)
library(viridis)    # provide the color palette
library(hrbrthemes) # provides themes for axis and plot

# default data in R
data <- iris

# glimpse of the data
head(data)

# plotting the Parallel Coordinates
ggparcoord(data, # data
           columns = 1:3, # plotting first 3 columns
           alphaLines = .4, # transparency of the color
           groupColumn = 5, order = "anyClass",
           showPoints = TRUE) +
  theme(
    plot.title = element_text(size=10)
  )
R
# Libraries
library(GGally)
library(viridis)    # provide the color palette
library(hrbrthemes) # provides themes for axis and plot

# default data in R
data <- iris

# glimpse of the data
head(data)

# plotting the Parallel Coordinates
ggparcoord(data, # data
           columns = 1:3, # plotting first 3 columns
           alphaLines = .4, # transparency of the color
           groupColumn = 5, order = "anyClass",
           scale = "globalminmax",
           showPoints = TRUE) +
  theme(
    plot.title = element_text(size=10)
  )
R
# Libraries
library(GGally)
library(viridis)    # provide the color palette
library(hrbrthemes) # provides themes for axis and plot

# default data in R
data <- iris

# glimpse of the data
head(data)

# plotting the Parallel Coordinates
ggparcoord(data, # data
           columns = 1:3, # plotting first 3 columns
           alphaLines = .4, # transparency of the color
           groupColumn = 5, order = "anyClass",
           scale = "std",
           showPoints = TRUE) +
  theme(
    plot.title = element_text(size=10)
  )
输出:
Sepal.Length Sepal.Width Petal.Length Petal.Width Species
1          5.1         3.5          1.4         0.2  setosa
2          4.9         3.0          1.4         0.2  setosa
3          4.7         3.2          1.3         0.2  setosa
4          4.6         3.1          1.5         0.2  setosa
5          5.0         3.6          1.4         0.2  setosa
6          5.4         3.9          1.7         0.4  setosa
示例 2:使用 MinMax 缩放
在这里,我们将使用带有scale = “globalminmax” 的 mixmax 缩放变量。
R
# Libraries
library(GGally)
library(viridis)    # provide the color palette
library(hrbrthemes) # provides themes for axis and plot

# default data in R
data <- iris

# glimpse of the data
head(data)

# plotting the Parallel Coordinates
ggparcoord(data, # data
           columns = 1:3, # plotting first 3 columns
           alphaLines = .4, # transparency of the color
           groupColumn = 5, order = "anyClass",
           scale = "globalminmax",
           showPoints = TRUE) +
  theme(
    plot.title = element_text(size=10)
  )
输出:
Sepal.Length Sepal.Width Petal.Length Petal.Width Species
1          5.1         3.5          1.4         0.2  setosa
2          4.9         3.0          1.4         0.2  setosa
3          4.7         3.2          1.3         0.2  setosa
4          4.6         3.1          1.5         0.2  setosa
5          5.0         3.6          1.4         0.2  setosa
6          5.4         3.9          1.7         0.4  setosa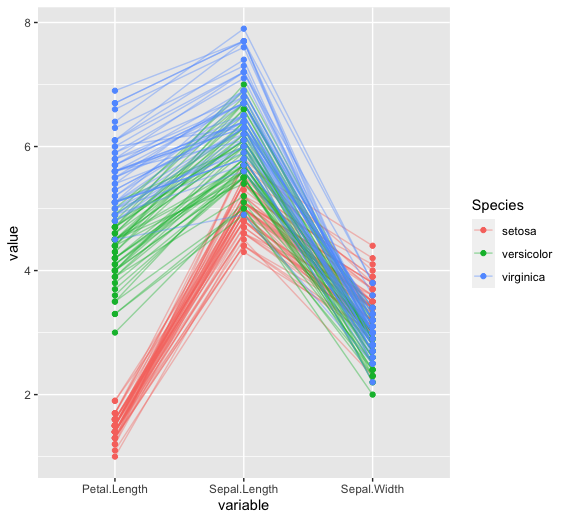
示例 3:通过标准化进行扩展
在这里,我们将使用带有scale = “std” 的标准化缩放变量。
R
# Libraries
library(GGally)
library(viridis)    # provide the color palette
library(hrbrthemes) # provides themes for axis and plot

# default data in R
data <- iris

# glimpse of the data
head(data)

# plotting the Parallel Coordinates
ggparcoord(data, # data
           columns = 1:3, # plotting first 3 columns
           alphaLines = .4, # transparency of the color
           groupColumn = 5, order = "anyClass",
           scale = "std",
           showPoints = TRUE) +
  theme(
    plot.title = element_text(size=10)
  )
输出:
Sepal.Length Sepal.Width Petal.Length Petal.Width Species
1          5.1         3.5          1.4         0.2  setosa
2          4.9         3.0          1.4         0.2  setosa
3          4.7         3.2          1.3         0.2  setosa
4          4.6         3.1          1.5         0.2  setosa
5          5.0         3.6          1.4         0.2  setosa
6          5.4         3.9          1.7         0.4  setosa