稳健的相关性
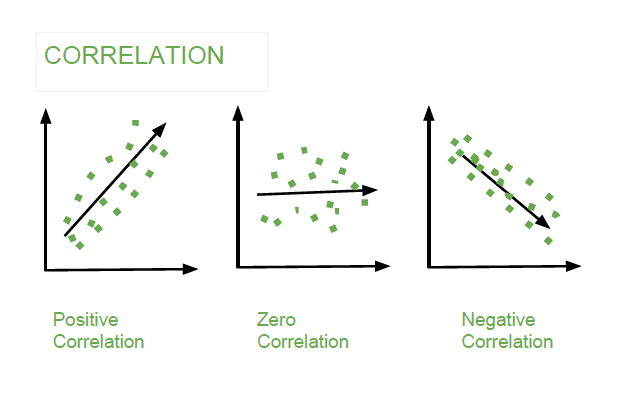
相关性是一种统计工具,用于分析和衡量两个或多个变量之间的相关程度或关联程度。相关性一般分为三种:
- 正相关:当我们增加一个变量的值时,另一个变量的值分别增加,这称为正相关。
- 负相关:当我们增加一个变量的值时,另一个变量的值分别减小,这称为负相关。
- 零相关:当一个变量值的变化对另一个变量没有实质性影响时,称为零相关。
皮尔逊相关性:
Pearson 相关性是计算相关性的最常用方法。它用 r 表示。考虑两个变量 x 和 y,它由以下公式表示:

接近 -1 的值表示完全负相关,而 0 表示无相关,1 表示强正相关。
Pearson 相关系数可以很好地估计正态分布的两个变量之间的相关性。但是,它不满足稳健估计器的标准,因为它不是:
- 抗性:这意味着即使更改少量数据也不会显着影响估计值。
- Robustness of Efficiency :统计量在多种情况下而不是在任何一种情况下都具有较高的效率。效率意味着估计接近最优估计,因为我们知道数据来自什么分布。
效率可以使用以下公式来衡量:

百分比弯曲相关:
百分比弯曲相关性是鞋匠和 Hettmanspergr 在 1982 年提出的,Wilcox 在他的书中也提到过。这种相关性对效率具有抵抗力和鲁棒性。
以下是对两个变量 X 和 Y 执行百分比弯曲相关的步骤:
- 设置 m = (1-\beta) *m + 0.5,将 m 舍入为最接近的整数。这里,β 介于 0 和 0.5 之间
- 取 W_{i} = |X_{i} – M_{x}|对于 i = 1, 2, …n,其中 M_x 是 X 的中位数。
- 按升序对 W_i 进行排序。
 ,其中 W(m) 是 W 的 (1-β) 分位数的估计值。
- 对 X 值进行排序。
- 计算 <-1 并存储在 i_1 中的值 \frac{(X_{i} – M_{x})}{\hat{W}_{x}(\beta)} 的数量以及 > +1 并存储在
 分别。然后计算以下内容:


- 对 Y 估计器重复上述步骤,得到 \hat{W_y}、\hat{\phi}_{y} 和 V_i。
- 定义函数:
![\Psi(x) = \max[-1, \min(1,x)]](https://mangodoc.oss-cn-beijing.aliyuncs.com/geek8geeks/Robust_Correlation_8.png "由 QuickLaTeX.com 渲染")
因此计算,

- 计算百分比弯曲相关性:

温莎相关:
像 Pearson 这样的标准相关性有时会受到极值的严重影响。 Winsorized 相关通过将尾部值设置为某个百分位值来解决此问题。
例如,对于 90% 的 Winsorized 相关性,将底部 5% 的值设置为等于对应于第 5 个百分位的值,而将顶部 5% 的值设置为等于对应于第 95 个百分位的值。然后应用标准相关性。
执行:
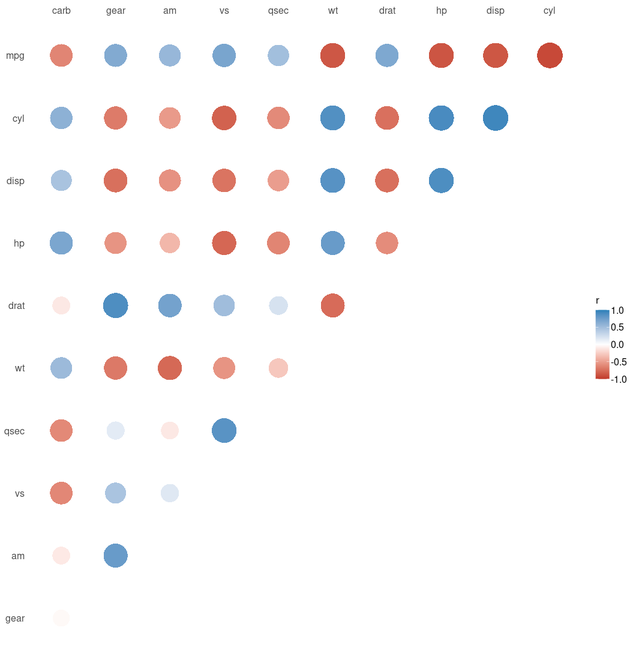
- 在这个实现中,我们将使用 R 图形库中可用的汽车趋势汽车道路测试数据集。它非常流行且易于使用。该数据集包含与汽车相关的 11 个不同变量的 32 个观察值。我们将在这些变量(Pearson、百分比弯曲和 Winsorized)之间进行相关分析并绘制它们。
R
# Install the required packages
install.packages("dplyr")
install.packages("correlation")
install.packages("see")

# import required packages
library(dplyr)
library(correlation)
library(see)

# Load data
data("mtcars")
# check help for mtcars data
?mtcars

## Description
# The data was extracted from the 1974 Motor Trend US magazine,
# and comprises fuel consumption and 10 aspects of automobile
# design and performance for 32 automobiles
#(1973–74 models).

## Usage
# mtcars

## Format
# A data frame with 32 observations on 11 (numeric) variables.
#
# [, 1]    mpg    Miles/(US) gallon
# [, 2]    cyl    Number of cylinders
# [, 3]    disp    Displacement (cu.in.)
# [, 4]    hp    Gross horsepower
# [, 5]    dart    Rear axle ratio
# [, 6]    wt    Weight (1000 lbs)
# [, 7]    qsec    1/4 mile time
# [, 8]    vs    Engine (0 = V-shaped, 1 = straight)
# [, 9]    am    Transmission (0 = automatic, 1 = manual)
# [,10]    gear    Number of forward gears
# [,11]    carb    Number of carburetors

## Source
# Henderson and Velleman (1981), Building multiple regression
# models interactively. Biometrics, 37, 391–411.

# perform different correlation and print summary

# pearson correlation
pearson_corr = correlation(mtcars)
pearson_summary = summary(pearson_corr)
print(pearson_summary)

# percentage bend correlation
pbc_corr = correlation(mtcars,method='percentage')
pbc_summary= summary(pbc_corr)
print(pbc_summary)

# winsorized correlation
wins_corr = correlation(mtcars, winsorize = 0.2)
winsor_summary = summary(wins_corr)
print(winsor_summary)

# plot different correlation analysis
pearson_summary%>%plot()
pbc_summary%>%plot()
winsor_summary%>%plot()
# Correlation Matrix (pearson-method)
Parameter | carb | gear | am | vs | qsec | wt | dart | hp | disp | cyl
---------------------------------------------------------------------------------------------------------------------
mpg | -0.55* | 0.48 | 0.60** | 0.66** | 0.42 | -0.87*** | 0.68*** | -0.78*** | -0.85*** | -0.85***
cyl | 0.53* | -0.49 | -0.52* | -0.81*** | -0.59* | 0.78*** | -0.70*** | 0.83*** | 0.90*** |
disp | 0.39 | -0.56* | -0.59* | -0.71*** | -0.43 | 0.89*** | -0.71*** | 0.79*** | |
hp | 0.75*** | -0.13 | -0.24 | -0.72*** | -0.71*** | 0.66** | -0.45 | | |
dart | -0.09 | 0.70*** | 0.71*** | 0.44 | 0.09 | -0.71*** | | | |
wt | 0.43 | -0.58* | -0.69*** | -0.55* | -0.17 | | | | |
qsec | -0.66** | -0.21 | -0.23 | 0.74*** | | | | | |
vs | -0.57* | 0.21 | 0.17 | | | | | | |
am | 0.06 | 0.79*** | | | | | | | |
gear | 0.27 | | | | | | | | |
p-value adjustment method: Holm (1979)># Correlation Matrix (percentage-method)
Parameter | carb | gear | am | vs | qsec | wt | dart | hp | disp | cyl
----------------------------------------------------------------------------------------------------------------------
mpg | -0.64** | 0.55* | 0.58** | 0.68*** | 0.48 | -0.90*** | 0.68*** | -0.90*** | -0.88*** | -0.91***
cyl | 0.58* | -0.55* | -0.52* | -0.81*** | -0.60** | 0.85*** | -0.72*** | 0.91*** | 0.94*** |
disp | 0.47 | -0.61** | -0.60** | -0.73*** | -0.50 | 0.88*** | -0.74*** | 0.89*** | |
hp | 0.70*** | -0.37 | -0.40 | -0.79*** | -0.69*** | 0.80*** | -0.59** | | |
dart | -0.11 | 0.78*** | 0.73*** | 0.47 | 0.13 | -0.76*** | | | |
wt | 0.53* | -0.64** | -0.76*** | -0.57* | -0.26 | | | | |
qsec | -0.68*** | -0.13 | -0.17 | 0.80*** | | | | | |
vs | -0.62** | 0.27 | 0.17 | | | | | | |
am | -0.07 | 0.80*** | | | | | | | |
gear | 0.11 | | | | | | | | |
p-value adjustment method: Holm (1979)># Winsorized Correlation Matrix
Parameter | carb | gear | am | vs | qsec | wt | dart | hp | disp | cyl
---------------------------------------------------------------------------------------------------------------------
mpg | -0.63** | 0.65** | 0.55* | 0.70*** | 0.49 | -0.86*** | 0.67*** | -0.88*** | -0.87*** | -0.93***
cyl | 0.60** | -0.68*** | -0.52* | -0.81*** | -0.60** | 0.87*** | -0.74*** | 0.90*** | 0.94*** |
disp | 0.45 | -0.74*** | -0.57* | -0.72*** | -0.51* | 0.85*** | -0.74*** | 0.89*** | |
hp | 0.69*** | -0.56* | -0.37 | -0.79*** | -0.63** | 0.77*** | -0.60** | | |
dart | -0.12 | 0.88*** | 0.72*** | 0.50* | 0.22 | -0.76*** | | | |
wt | 0.53* | -0.69*** | -0.78*** | -0.56* | -0.29 | | | | |
qsec | -0.61** | 0.15 | -0.12 | 0.84*** | | | | | |
vs | -0.62** | 0.45 | 0.17 | | | | | | |
am | -0.11 | 0.78*** | | | | | | | |
gear | -0.03 | | | | | | | | |
p-value adjustment method: Holm (1979)
皮尔逊相关

百分比弯曲相关
温莎相关
参考:
- 百分比弯曲相关 NIST
- Winsorized 相关 NIST
- Easystats 关联库