先决条件– RGB图像表示
彩色图像可以表示为3阶矩阵。第一个顺序用于行,第二个顺序用于列,第三个顺序用于指定相应像素的颜色。在这里,我们使用RGB颜色格式,因此三阶将分别采用红色,绿色和蓝色的3个值。行和列的值取决于图像的大小。
方法:
- 使用imread()将图像加载到变量J中。
- 将图像的行数和列数存储在变量r和c中。
- 创建大小为rXc的3个零矩阵R,G和B(每种3种颜色之一)。
- 将图像的相应颜色平面存储在相应的零矩阵中。
1: Red 2: Green 3: Blue - 通过使用imshow()显示图像,但首先将其类型转换为uint8 。
执行:
% MATLAB code to display the red, green and blue
% color planes of a color image

% read the image
I = imread('lenna.png');

% rows and columns in the image
r = size(I, 1);
c = size(I, 2);

% creating zero matrices
R = zeros(r, c, 3);
G = zeros(r, c, 3);
B = zeros(r, c, 3);

% storing the corresponding color plane

% red plane
R(:, :, 1) = I(:, :, 1);

% green plane
G(:, :, 2) = I(:, :, 2);

% blue plane
B(:, :, 3) = I(:, :, 3);

% displaying the images
figure, imshow(uint8(R));
figure, imshow(uint8(G));
figure, imshow(uint8(B));
输入 : 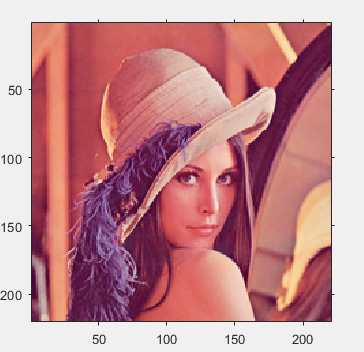
输出 : 

