Matplotlib 中的事件处理
基于事件的系统通常是一组重复出现的模式的一部分。通常,它们包括以下内容:
- 传入事件
- 用于响应事件的机制
- 循环结构(例如,while 循环、监听器和消息分发机制)
触发的事件也更丰富一些,包括事件发生在哪个 Axes 等信息。这些事件还了解 Matplotlib 坐标系,并以像素坐标和数据坐标报告事件位置。
句法:
figure.canvas.mpl_connect( Event_name , callback function or method)
参数:
- Event_name:它可以是下表中的任何一个
- callback_function:它将定义处理事件。
事件列表
Event_name | class | Description |
|---|---|---|
| button_press_event | MouseEvent | The mouse button is pressed |
| button_release_event | MouseEvent | The mouse button is released |
| draw_event | DrawEvent | The canvas draw occurs |
| key_press_event | KeyEvent | A key is pressed |
| key_release_event | KeyEvent | A key is released |
| motion_notify_event | MouseEvent | The motion of the mouse |
| pick_event | PickEvent | An object in the canvas is selected |
| resize_event | ResizeEvent | The figure canvas is resized |
| scroll_event | MouseEvent | The scroll wheel of the mouse is rolled |
| figure_enter_event | LocationEvent | The mouse enters a figure |
| axes_enter_event | LocationEvent | The mouse enters an axes object |
| axes_leave_event | LocationEvent | The mouse leaves an axes object |
| figure_leave_event | LocationEvent | The mouse leaves a figure |
注意:这些类是在 matplotlib.backend_bases 中定义的
鼠标事件
- button_press_event:此事件涉及鼠标按钮按下
- button_release_event:此事件涉及鼠标按钮释放
- scroll_event:此事件涉及鼠标的滚动
- motion_notify_event:此事件涉及与鼠标移动有关的通知
例子:
我们使用了 mpl_connect 方法,如果您想在绘图中提供自定义用户交互功能,则必须调用该方法。此方法将采用两个参数:
- 事件的字符串值,可以是上表事件名称列中列出的任意值
- 回调函数或方法
Python3
# importing the necessary modules
from IPython.display import Image
import matplotlib.pyplot as plt
import matplotlib as mpl
import numpy as np
import time
import sys
import random
import matplotlib
matplotlib.use('nbagg')


class MouseEvent:

    # initialization
    def __init__(self):
        (figure, axes) = plt.subplots()
        axes.set_aspect(1)
        figure.canvas.mpl_connect('button_press_event', self.press)
        figure.canvas.mpl_connect('button_release_event', self.release)

    # start event to show the plot
    def start(self):
        plt.show()  # display the plot

    # press event will keep the starting time when u
    # press mouse button
    def press(self, event):
        self.start_time = time.time()

    # release event will keep the track when you release
    # mouse button
    def release(self, event):
        self.end_time = time.time()
        self.draw_click(event)

    # drawing the plot
    def draw_click(self, event):
        # size = square (4 * duration of the time button
        # is keep pressed )
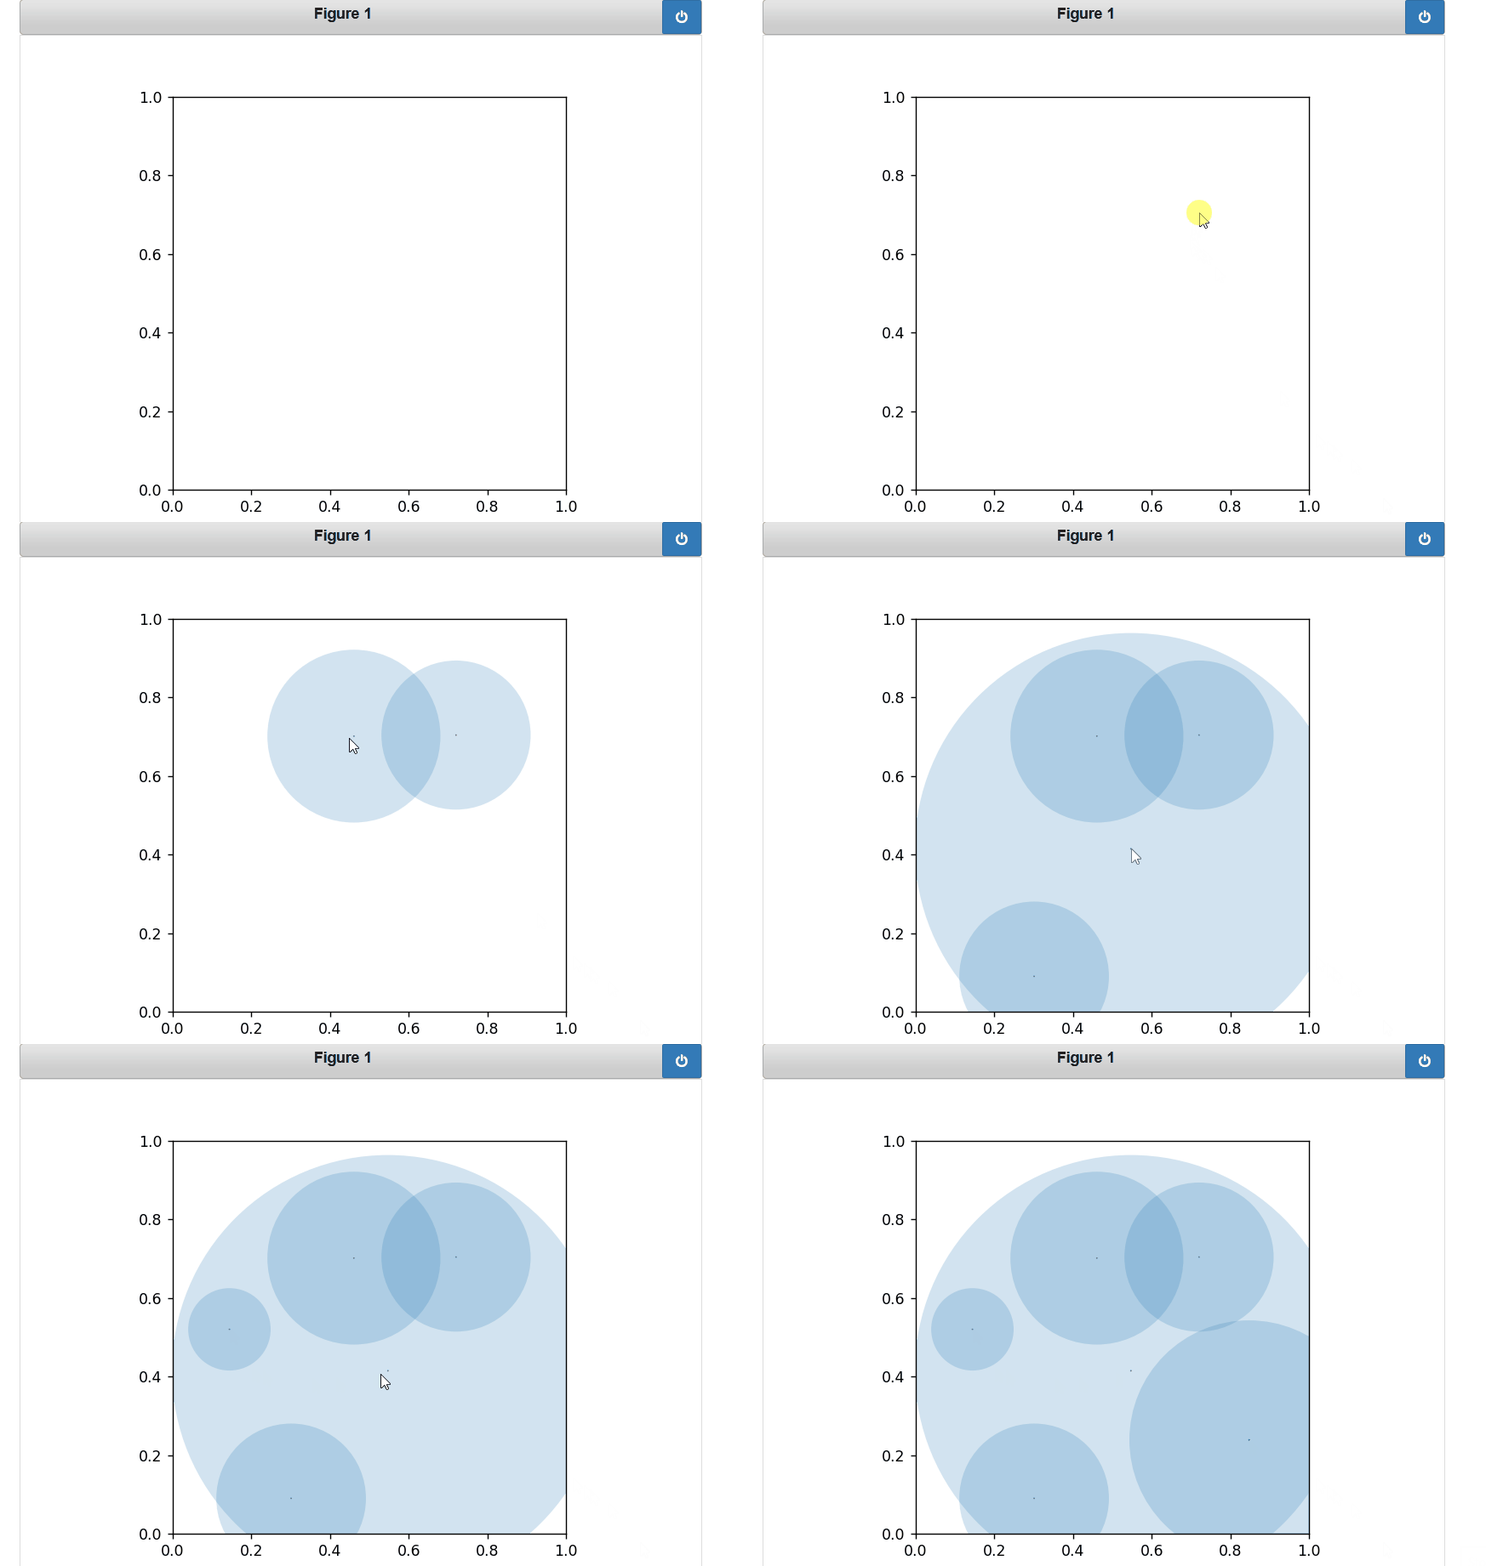
        size = 4 * (self.end_time - self.start_time) ** 2

        # create a point of size=0.002 where mouse button
        # clicked on the plot
        c1 = plt.Circle([event.xdata, event.ydata], 0.002,)

        # create a circle of radius 0.02*size
        c2 = plt.Circle([event.xdata, event.ydata], 0.02 * size, alpha=0.2)
        event.canvas.figure.gca().add_artist(c1)
        event.canvas.figure.gca().add_artist(c2)
        event.canvas.figure.show()


cbs = MouseEvent()

# start the event
cbs.start()
Python3
def draw_click(self, event):

    # you can specified your own color list
    col = ['magneta', 'lavender', 'salmon', 'yellow', 'orange']
    cn = random.randint(0, 5)

    # size = square (4 * duration of the time button
    # is keep pressed )
    size = 4 * (self.end_time - self.start_time) ** 2

    # create a point of size=0.002 where mouse button
    # clicked on the plot
    c1 = plt.Circle([event.xdata, event.ydata], 0.002,)

    # create a circle of radius 0.02*size
    c2 = plt.Circle([event.xdata, event.ydata], 0.02 *
                    size, alpha=0.2, color=col[cn])
    event.canvas.figure.gca().add_artist(c1)
    event.canvas.figure.gca().add_artist(c2)
    event.canvas.figure.show()
输出 :

示例 2:
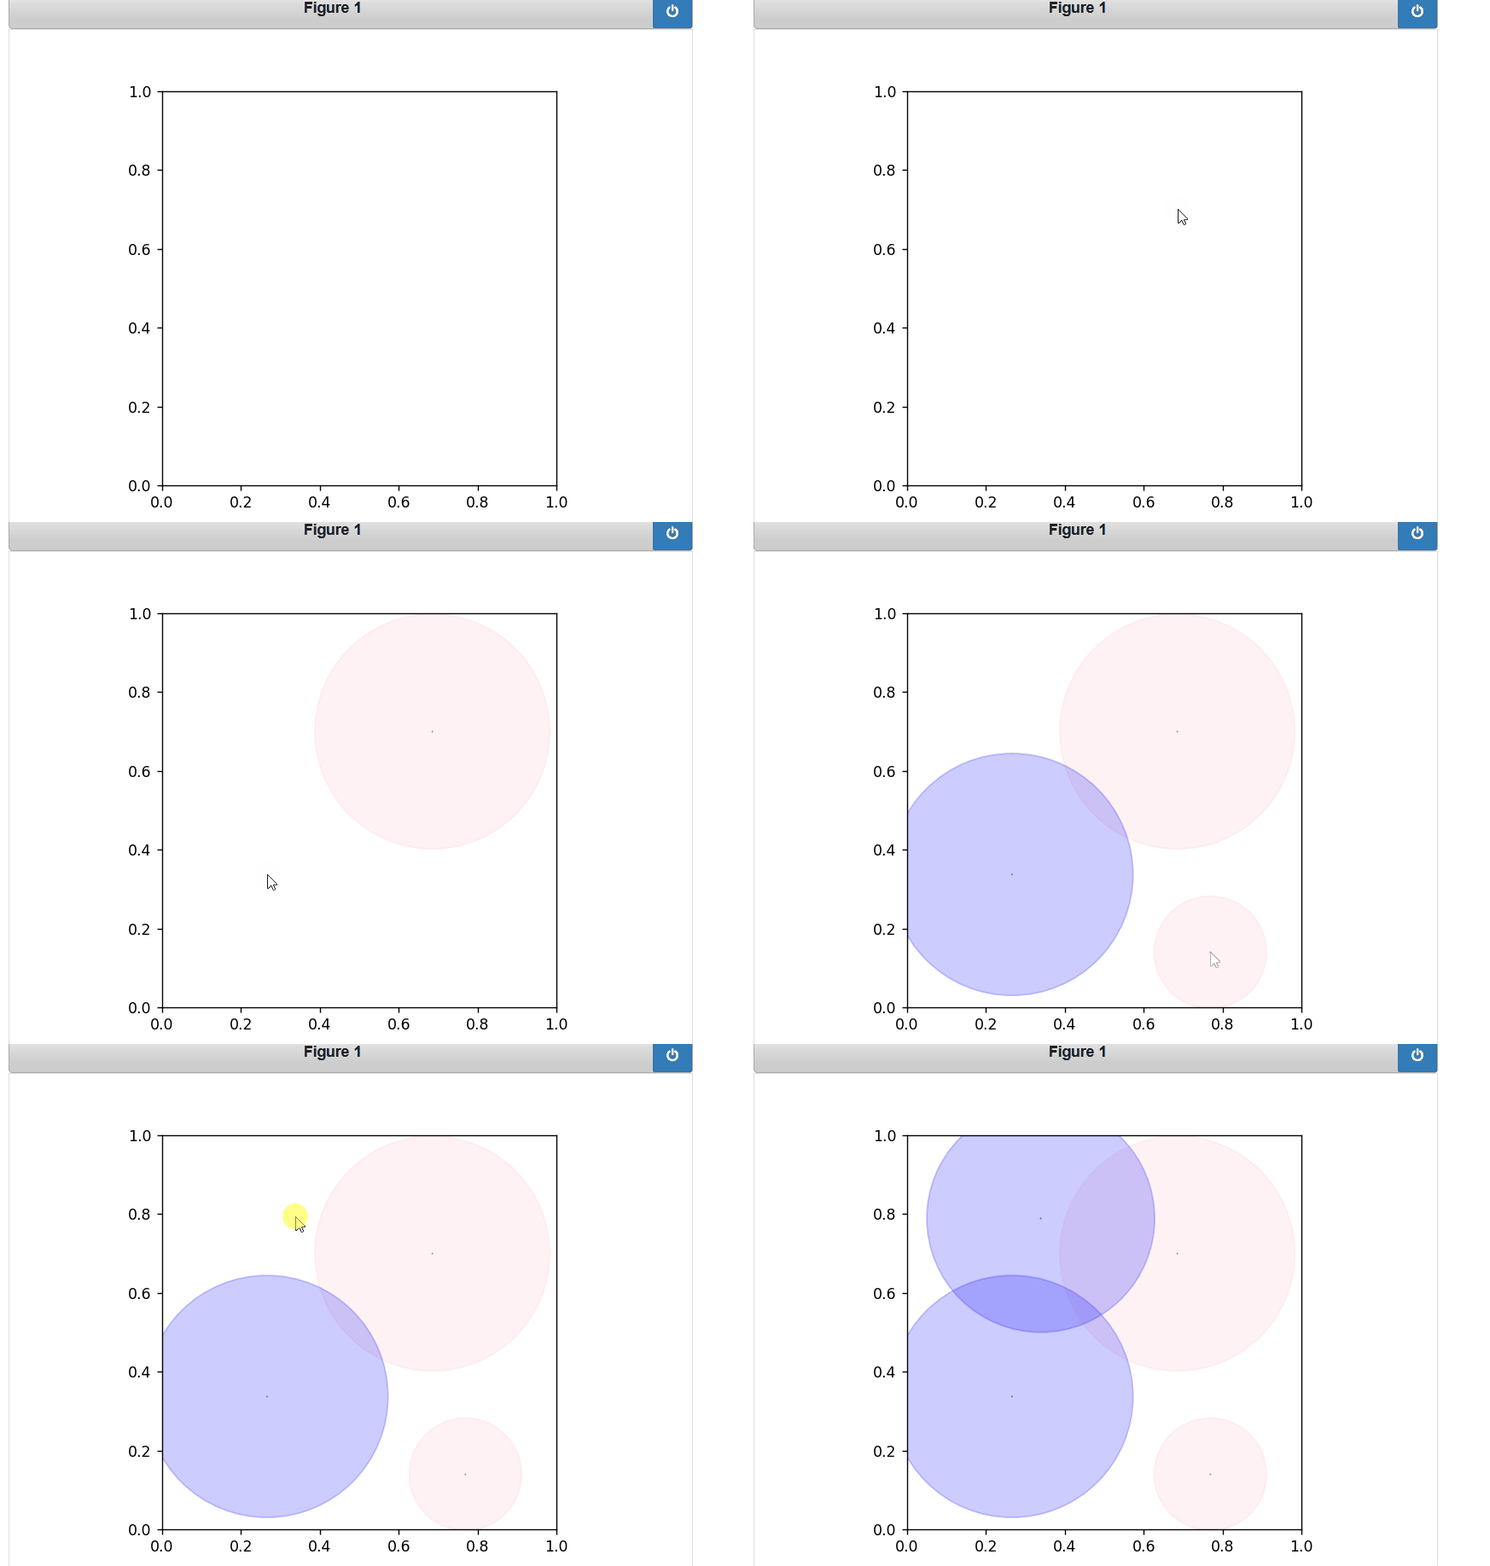
我们将使用 draw_click 方法添加颜色
Python3
def draw_click(self, event):

    # you can specified your own color list
    col = ['magneta', 'lavender', 'salmon', 'yellow', 'orange']
    cn = random.randint(0, 5)

    # size = square (4 * duration of the time button
    # is keep pressed )
    size = 4 * (self.end_time - self.start_time) ** 2

    # create a point of size=0.002 where mouse button
    # clicked on the plot
    c1 = plt.Circle([event.xdata, event.ydata], 0.002,)

    # create a circle of radius 0.02*size
    c2 = plt.Circle([event.xdata, event.ydata], 0.02 *
                    size, alpha=0.2, color=col[cn])
    event.canvas.figure.gca().add_artist(c1)
    event.canvas.figure.gca().add_artist(c2)
    event.canvas.figure.show()
输出:
