Mahotas – 过滤标签
在本文中,我们将了解如何在 mahotas 中过滤已标记图像的标签。过滤标签类似于实现重新标记功能,但不同之处在于过滤我们将删除,即在调用过滤方法时过滤标签,过滤将为我们提供新的标签图像和标签数量。我们使用 mahotas.label 方法来标记图像
为此,我们将使用来自核分割基准的荧光显微镜图像。我们可以在下面给出的命令的帮助下获取图像
mhotas.demos.nuclear_image()下面是nuclear_image
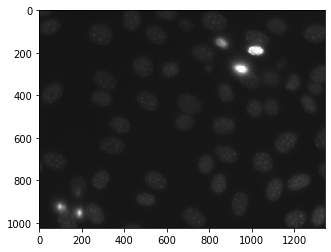
标记图像是整数图像,其中值对应于不同区域。即,区域 1 是所有值为 1 的像素,区域 2 是值为 2 的像素,依此类推
为此,我们将使用 mahotas.label.filter_labelled 方法
Syntax : mahotas.label.filter_labelled(label_image, filter1, filter2)
Argument : It takes labelled image object and filters as argument
Return : It returns the labelled image and integer i.e number of labels
注意:过滤器可以是边框标签过滤器,最大尺寸任何东西。
示例 1:
Python3
# importing required libraries
import mahotas
import numpy as np
from pylab import imshow, show
import os

# loading nuclear image
f = mahotas.demos.load('nuclear')

# setting filter to the image
f = f[:, :, 0]

# setting gaussian filter
f = mahotas.gaussian_filter(f, 4)

# setting threshold value
f = (f> f.mean())

# creating a labelled image
labelled, n_nucleus = mahotas.label(f)

# printing number of labels
print("Count : " + str(n_nucleus))

# showing the labelled image
print("Labelled Image")
imshow(labelled)
show()


# filtering the label image
# adding border filter
relabelled, n_left = mahotas.labelled.filter_labelled(labelled, remove_bordering = True)

# showing number of labels
print("Count : " + str(n_left))

# showing the image
print("No border Label")
imshow(relabelled)
show()
Python3
# importing required libraries
import mahotas
import numpy as np
from pylab import imshow, show
import os

# loading nuclear image
f = mahotas.demos.load('nuclear')

# setting filter to the image
f = f[:, :, 0]

# setting gaussian filter
f = mahotas.gaussian_filter(f, 4)

# setting threshold value
f = (f> f.mean())

# creating a labelled image
labelled, n_nucleus = mahotas.label(f)

# printing number of labels
print("Count : " + str(n_nucleus))

# showing the labelled image
print("Labelled Image")
imshow(labelled)
show()


# filtering the label image
# adding max size filter
relabelled, n_left = mahotas.labelled.filter_labelled(labelled, max_size = 7000)

# showing number of labels
print("Count : " + str(n_left))

# showing the image
print("Max size 7000 Label")
imshow(relabelled)
show()
Python3
# importing required libraries
import mahotas
import numpy as np
from pylab import imshow, show
import os

# loading nuclear image
f = mahotas.demos.load('nuclear')

# setting filter to the image
f = f[:, :, 0]

# setting gaussian filter
f = mahotas.gaussian_filter(f, 4)

# setting threshold value
f = (f> f.mean())

# creating a labelled image
labelled, n_nucleus = mahotas.label(f)

# printing number of labels
print("Count : " + str(n_nucleus))

# showing the labelled image
print("Labelled Image")
imshow(labelled)
show()


# filtering the label image
# adding border filter
relabelled, n_left = mahotas.labelled.filter_labelled(labelled, remove_bordering = True)

# showing number of labels
print("Count : " + str(n_left))

# showing the image
print("No border Label")
imshow(relabelled)
show()
Python3
# importing required libraries
import mahotas
import numpy as np
from pylab import imshow, show
import os

# loading nuclear image
f = mahotas.demos.load('nuclear')

# setting filter to the image
f = f[:, :, 0]

# setting gaussian filter
f = mahotas.gaussian_filter(f, 4)

# setting threshold value
f = (f> f.mean())

# creating a labelled image
labelled, n_nucleus = mahotas.label(f)

# printing number of labels
print("Count : " + str(n_nucleus))

# showing the labelled image
print("Labelled Image")
imshow(labelled)
show()


# filtering the label image
# adding border filter
relabelled, n_left = mahotas.labelled.filter_labelled(labelled, remove_bordering = True)

# showing number of labels
print("Count : " + str(n_left))

# showing the image
print("No border Label")
imshow(relabelled)
show()
输出 :

示例 2:
Python3
# importing required libraries
import mahotas
import numpy as np
from pylab import imshow, show
import os

# loading nuclear image
f = mahotas.demos.load('nuclear')

# setting filter to the image
f = f[:, :, 0]

# setting gaussian filter
f = mahotas.gaussian_filter(f, 4)

# setting threshold value
f = (f> f.mean())

# creating a labelled image
labelled, n_nucleus = mahotas.label(f)

# printing number of labels
print("Count : " + str(n_nucleus))

# showing the labelled image
print("Labelled Image")
imshow(labelled)
show()


# filtering the label image
# adding max size filter
relabelled, n_left = mahotas.labelled.filter_labelled(labelled, max_size = 7000)

# showing number of labels
print("Count : " + str(n_left))

# showing the image
print("Max size 7000 Label")
imshow(relabelled)
show()
Python3
# importing required libraries
import mahotas
import numpy as np
from pylab import imshow, show
import os

# loading nuclear image
f = mahotas.demos.load('nuclear')

# setting filter to the image
f = f[:, :, 0]

# setting gaussian filter
f = mahotas.gaussian_filter(f, 4)

# setting threshold value
f = (f> f.mean())

# creating a labelled image
labelled, n_nucleus = mahotas.label(f)

# printing number of labels
print("Count : " + str(n_nucleus))

# showing the labelled image
print("Labelled Image")
imshow(labelled)
show()


# filtering the label image
# adding max size filter
relabelled, n_left = mahotas.labelled.filter_labelled(labelled, max_size = 7000)

# showing number of labels
print("Count : " + str(n_left))

# showing the image
print("Max size 7000 Label")
imshow(relabelled)
show()
输出 :
