PyCairo-绘制函数曲线
在本文中,我们将学习如何在Python中使用 PyCairo 绘制简单的函数曲线。在数学中,函数f 的图是一组有序对,其中 f(x) = y。在 x 和 f(x) 是实数的常见情况下,这些对是二维空间中点的笛卡尔坐标。
PyCairo :Pycairo 是一个Python模块,为 cairo 图形库提供绑定。该库用于在Python中创建 SVG,即矢量文件。打开 SVG 文件进行查看(只读)的最简单快捷的方法是使用现代 Web 浏览器,如 Chrome、Firefox、Edge 或 Internet Explorer——几乎所有这些浏览器都应该为 SVG 格式提供某种渲染支持。
SVG文件是使用万维网联盟 (W3C) 创建的二维矢量图形格式的图形文件。它使用基于 XML 的文本格式描述图像。 SVG 文件是作为在 Web 上显示矢量图形的标准格式而开发的。
实施步骤:
- 导入 Pycairo & Math 模块。
- 创建一个 SVG 表面对象并向其添加上下文。
- 创建用于创建功能曲线点的列表
- 遍历和绘制点
- 设置上下文的颜色和线宽
下面是实现:
Python3
# importing pycairo
import cairo
# importing Math to Sin & exp Function
import math
# Variable X
x = 0
# Creating list for creating points
points = []
# Creating Loop for points
while x < 5:
# Creating point corresponding x
y = math.sin(10*x)*math.exp(-x/2)
# Adding points to the list
points.append((x*100 + 50, y*100 + 200))
# Incrementing by 0.01 Variable x
x += 0.01
# creating a SVG surface
# here geek95 is file name & 700, 700 is dimension
with cairo.SVGSurface("geek95.svg", 700, 700) as surface:
# creating a cairo context object for SVG surface
# useing Context method
context = cairo.Context(surface)
context.move_to(*points[0])
# Traversing Points
for p in points[1:]:
# Ploting point
context.line_to(*p)
# setting width of the context
context.set_line_width(2)
# setting color of the context
context.set_source_rgb(0.2, 1, 0.2)
# stroke out the color and width property
context.stroke()
# printing message when file is saved
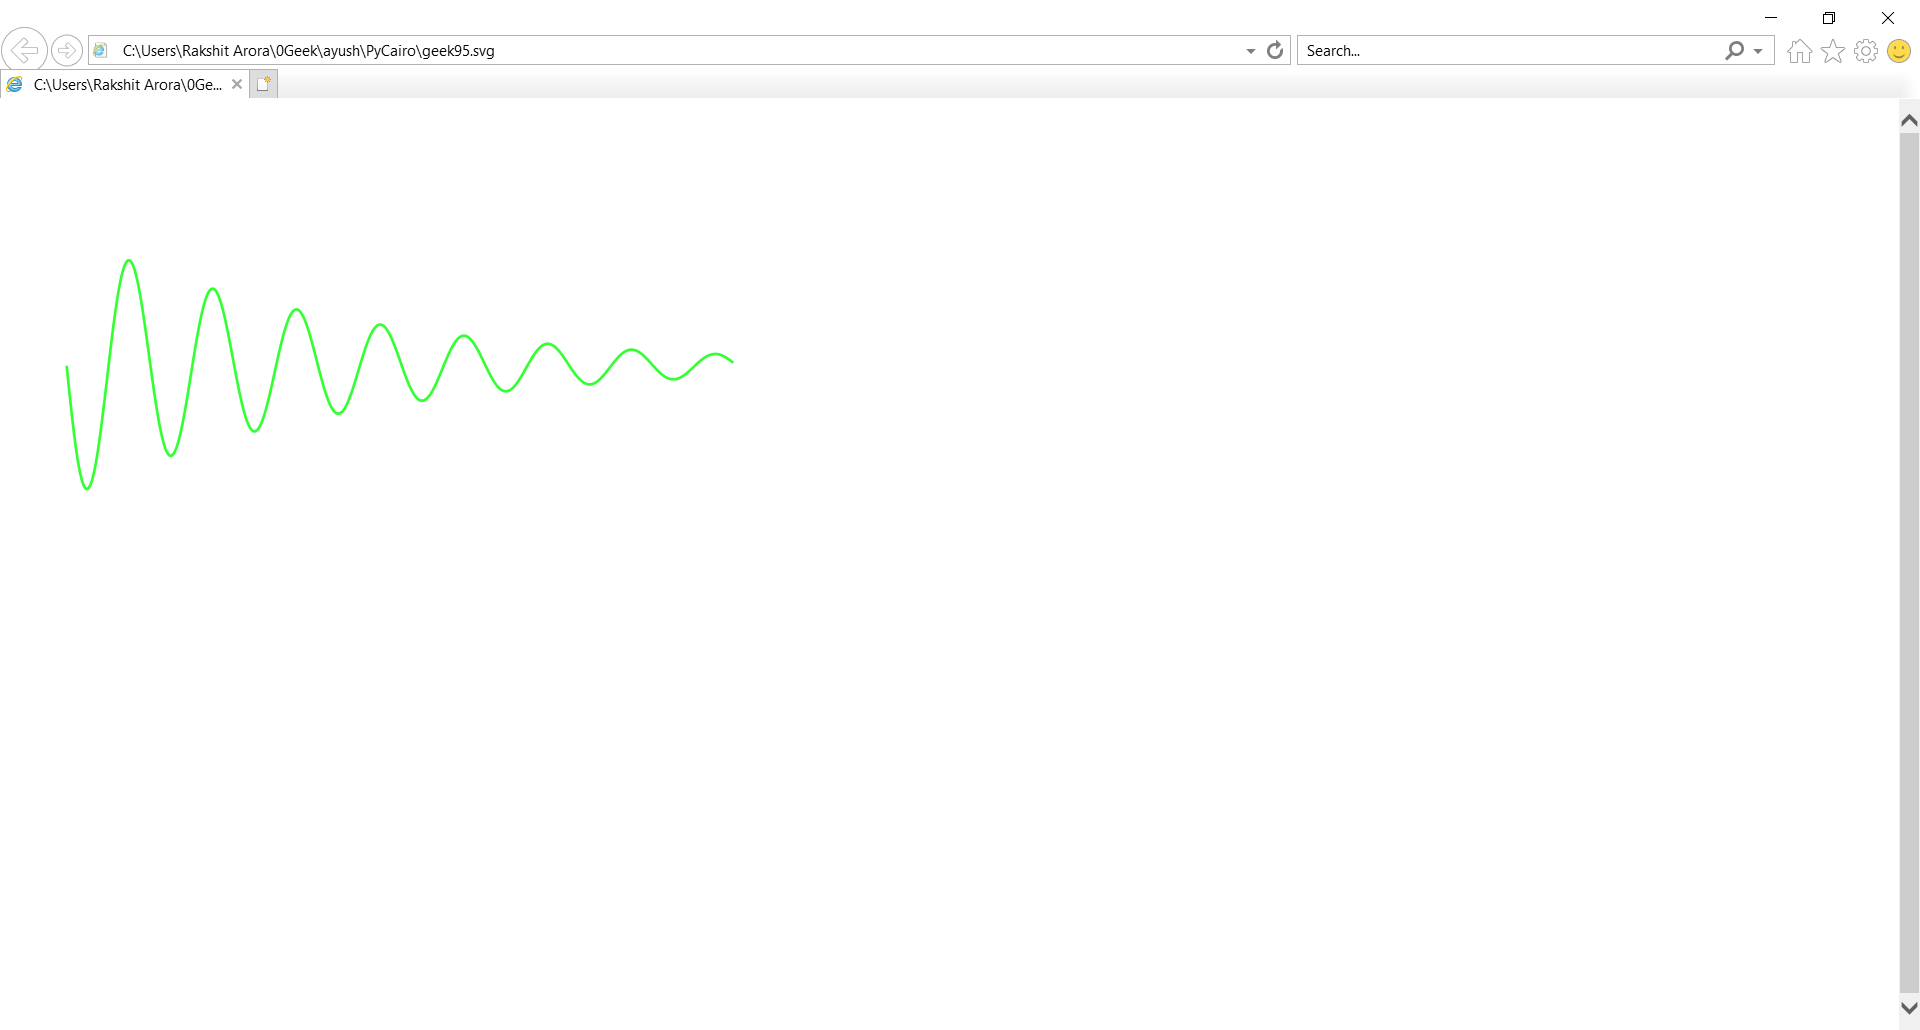
print("File Saved")输出 :