仅在 R 中的一侧设置 ggplot2 轴限制
在本文中,我们将在 R 编程语言中仅在绘图的一侧设置 ggplot2 绘图轴限制。
使用 scale_x_continous() 或 scale_y_continous()函数
scale_x_continous()/scale_y_continous()函数:此函数用于连续 x 或 y 美学的默认比例。
Syntax: scale_y_continuous(name = waiver(), breaks = waiver(), minor_breaks = waiver(), labels = waiver(), limits = NULL,expand = waiver(), oob = censor, na.value = NA_real_,trans = “identity”)
Parameters:
- name: The name of the scale. Used as axis or legend title.
- limits: A numeric vector of length two providing limits of the scale. Use NA to refer to the existing minimum or maximum.
- expand: A numeric vector of length two giving multiplicative and additive expansion constants.
- oob: Function that handles limits outside of the scale limits (out of bounds). The default replaces out-of-bounds values with NA.
- na.value: Missing values will be replaced with this value.
- trans: Either the name of a transformation object, or the object itself.
- …: Other arguments passed on to scale_(x|y)_continuous
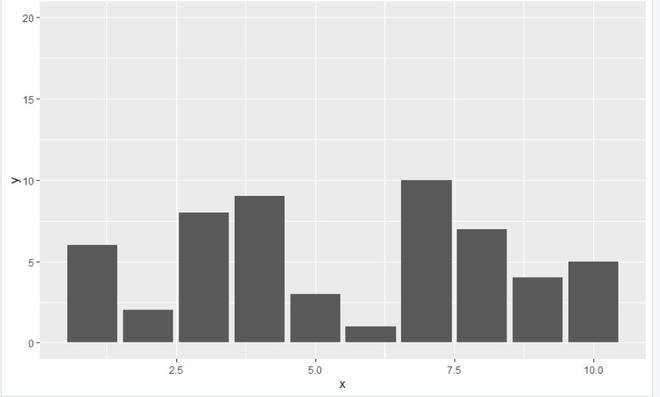
使用 scale_y_continuous 仅更改一个轴限制:
在此示例中,我们将绘制 10 个数据点的 ggplot2 图,以使用 R 编程语言中的 scale_y_continous()函数设置仅一个轴的轴限制,该轴将是 y 轴。
具有给定数据点的初始图看起来没有任何变化:
R
library(ggplot2)

data < - data.frame(x=c(4, 9, 5, 6, 10, 2, 3, 7, 8, 1),
                    y=c(9, 4, 3, 1, 5, 2, 8, 10, 7, 6))

plot < - ggplot(data, aes(x, y)) +
geom_bar(stat="identity")

plot
R
library(ggplot2)

data < - data.frame(x=c(4, 9, 5, 6, 10, 2, 3, 7, 8, 1),
                    y=c(9, 4, 3, 1, 5, 2, 8, 10, 7, 6))

plot < - ggplot(data, aes(x, y)) +
geom_bar(stat="identity") +
scale_y_continuous(limits=c(0, 20))

plot
R
library(ggplot2)

data < - data.frame(x=c(4, 9, 5, 6, 10, 2, 3, 7, 8, 1),
                    y=c(9, 4, 3, 1, 5, 2, 8, 10, 7, 6))

plot < - ggplot(data, aes(x, y)) +
geom_bar(stat="identity") +
scale_x_continuous(limits=c(0, 20))

plot
输出:

使用给定数据的 scale_y_continous()函数设置仅一个轴的轴限制,该轴将是 y 轴:
电阻
library(ggplot2)

data < - data.frame(x=c(4, 9, 5, 6, 10, 2, 3, 7, 8, 1),
                    y=c(9, 4, 3, 1, 5, 2, 8, 10, 7, 6))

plot < - ggplot(data, aes(x, y)) +
geom_bar(stat="identity") +
scale_y_continuous(limits=c(0, 20))

plot
输出:
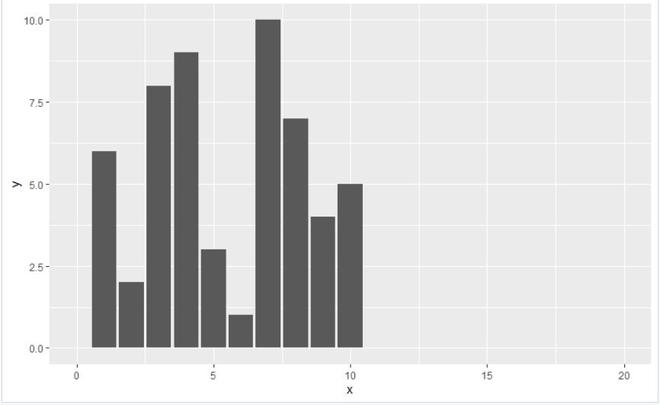
使用 scale_x_continuous() 仅更改一个轴限制
在此示例中,我们将绘制 10 个数据点的 ggplot2 图,以使用 R 编程语言中的 scale_x_continous()函数设置仅一个轴的轴限制,该轴将是 x 轴。
电阻
library(ggplot2)

data < - data.frame(x=c(4, 9, 5, 6, 10, 2, 3, 7, 8, 1),
                    y=c(9, 4, 3, 1, 5, 2, 8, 10, 7, 6))

plot < - ggplot(data, aes(x, y)) +
geom_bar(stat="identity") +
scale_x_continuous(limits=c(0, 20))

plot
输出: