Python中的 Matplotlib.artist.Artist.findobj()
Matplotlib是Python中的一个库,它是 NumPy 库的数值数学扩展。 Artist 类包含呈现为 FigureCanvas 的对象的 Abstract 基类。图中所有可见元素都是 Artist 的子类。
Matplotlib.artist.Artist.findobj() 方法
matplotlib 库的艺术家模块中的 findobj () 方法用于返回查找艺术家对象。
Syntax: Artist.findobj(self, match=None, include_self=True)
Parameters: This method accepts the following parameters.
- match : This parameter is the filter criterion for the matches. It default value is None.
- include_self : This parameter include self in the list to be checked for a match.
Returns: This method return artists(list of Artist).
下面的示例说明了 matplotlib.artist.Artist。 matplotlib 中的findobj ()函数:
示例 1:
# Implementation of matplotlib function
from matplotlib.artist import Artist
import matplotlib.pyplot as plt
from matplotlib.lines import Line2D
import numpy as np
from numpy.random import rand


fig, ax2 = plt.subplots()

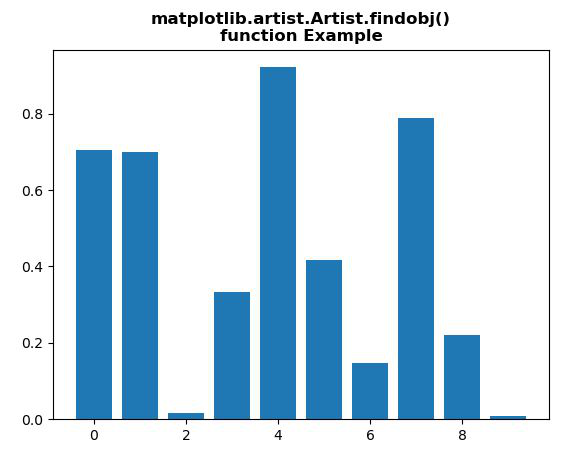
ax2.bar(range(10), rand(10), picker = True)

print("Value return : \n",
      *list(Artist.findobj(ax2)), sep ="\n")

plt.title("""matplotlib.artist.Artist.findobj()
function Example""", fontweight="bold")

plt.show()
输出:
Value return :

Rectangle(xy=(-0.4, 0), width=0.8, height=0.705031, angle=0)
Rectangle(xy=(0.6, 0), width=0.8, height=0.698788, angle=0)
Rectangle(xy=(1.6, 0), width=0.8, height=0.0159568, angle=0)
Rectangle(xy=(2.6, 0), width=0.8, height=0.332931, angle=0)
Rectangle(xy=(3.6, 0), width=0.8, height=0.921611, angle=0)
Rectangle(xy=(4.6, 0), width=0.8, height=0.4171, angle=0)
Rectangle(xy=(5.6, 0), width=0.8, height=0.148145, angle=0)
Rectangle(xy=(6.6, 0), width=0.8, height=0.78801, angle=0)
Rectangle(xy=(7.6, 0), width=0.8, height=0.221423, angle=0)
Rectangle(xy=(8.6, 0), width=0.8, height=0.00829394, angle=0)
Spine
Spine
Spine
Spine
Text(0.5, 0, '')
Text(1, 0, '')
Line2D()
Line2D()
Line2D((0,0),(0,1))
Text(0, 0, '')
Text(0, 1, '')

Line2D()
Line2D()
Line2D((0,0),(0,1))
Text(0, 0, '')
Text(0, 1, '')

Line2D()
Line2D()
Line2D((0,0),(0,1))
Text(0, 0, '')
Text(0, 1, '')

Line2D()
Line2D()
Line2D((0,0),(0,1))
Text(0, 0, '')
Text(0, 1, '')

Line2D()
Line2D()
Line2D((0,0),(0,1))
Text(0, 0, '')
Text(0, 1, '')

Line2D()
Line2D()
Line2D((0,0),(0,1))
Text(0, 0, '')
Text(0, 1, '')

Line2D()
Line2D()
Line2D((0,0),(0,1))
Text(0, 0, '')
Text(0, 1, '')

XAxis(80.0,52.8)
Text(0, 0.5, '')
Text(0, 0.5, '')
Line2D()
Line2D()
Line2D((0,0),(1,0))
Text(0, 0, '')
Text(1, 0, '')

Line2D()
Line2D()
Line2D((0,0),(1,0))
Text(0, 0, '')
Text(1, 0, '')

Line2D()
Line2D()
Line2D((0,0),(1,0))
Text(0, 0, '')
Text(1, 0, '')

Line2D()
Line2D()
Line2D((0,0),(1,0))
Text(0, 0, '')
Text(1, 0, '')

Line2D()
Line2D()
Line2D((0,0),(1,0))
Text(0, 0, '')
Text(1, 0, '')

Line2D()
Line2D()
Line2D((0,0),(1,0))
Text(0, 0, '')
Text(1, 0, '')

YAxis(80.0,52.8)
Text(0.5, 1.0, '')
Text(0.0, 1.0, '')
Text(1.0, 1.0, '')
Rectangle(xy=(0, 0), width=1, height=1, angle=0)
AxesSubplot(0.125,0.11;0.775x0.77)
示例 2:
# Implementation of matplotlib function
from matplotlib.artist import Artist
import numpy as np
import matplotlib.pyplot as plt
import matplotlib.patches as mpatches


fig, ax = plt.subplots()
x, y = 10 * np.random.rand(2, 1000)
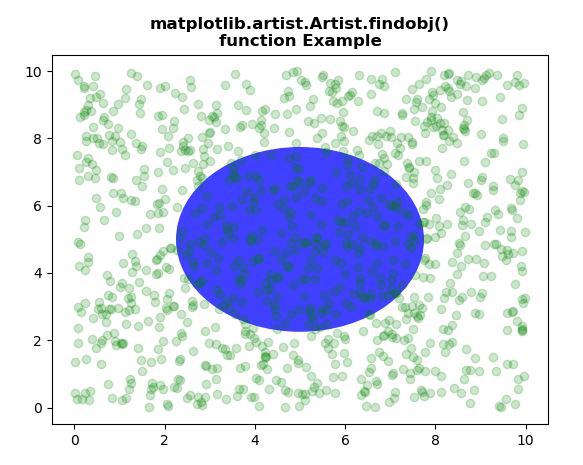
ax.plot(x, y, 'go', alpha = 0.2)

circ = mpatches.Circle((0.5, 0.5), 0.25,
                       transform = ax.transAxes,
                       facecolor ='blue',
                       alpha = 0.75)
ax.add_patch(circ)

print("Value return : \n",
      *list(Artist.findobj(ax)), sep ="\n")

plt.title("""matplotlib.artist.Artist.findobj()
function Example""", fontweight="bold")

plt.show()
输出:
Value return :

Circle(xy=(0.5, 0.5), radius=0.25)
Line2D(_line0)
Spine
Spine
Spine
Spine
Text(0.5, 0, '')
Text(1, 0, '')
Line2D()
Line2D()
Line2D((0,0),(0,1))
Text(0, 0, '')
Text(0, 1, '')

Line2D()
Line2D()
Line2D((0,0),(0,1))
Text(0, 0, '')
Text(0, 1, '')

Line2D()
Line2D()
Line2D((0,0),(0,1))
Text(0, 0, '')
Text(0, 1, '')

Line2D()
Line2D()
Line2D((0,0),(0,1))
Text(0, 0, '')
Text(0, 1, '')

Line2D()
Line2D()
Line2D((0,0),(0,1))
Text(0, 0, '')
Text(0, 1, '')

Line2D()
Line2D()
Line2D((0,0),(0,1))
Text(0, 0, '')
Text(0, 1, '')

Line2D()
Line2D()
Line2D((0,0),(0,1))
Text(0, 0, '')
Text(0, 1, '')

Line2D()
Line2D()
Line2D((0,0),(0,1))
Text(0, 0, '')
Text(0, 1, '')

XAxis(80.0,52.8)
Text(0, 0.5, '')
Text(0, 0.5, '')
Line2D()
Line2D()
Line2D((0,0),(1,0))
Text(0, 0, '')
Text(1, 0, '')

Line2D()
Line2D()
Line2D((0,0),(1,0))
Text(0, 0, '')
Text(1, 0, '')

Line2D()
Line2D()
Line2D((0,0),(1,0))
Text(0, 0, '')
Text(1, 0, '')

Line2D()
Line2D()
Line2D((0,0),(1,0))
Text(0, 0, '')
Text(1, 0, '')

Line2D()
Line2D()
Line2D((0,0),(1,0))
Text(0, 0, '')
Text(1, 0, '')

Line2D()
Line2D()
Line2D((0,0),(1,0))
Text(0, 0, '')
Text(1, 0, '')

Line2D()
Line2D()
Line2D((0,0),(1,0))
Text(0, 0, '')
Text(1, 0, '')

Line2D()
Line2D()
Line2D((0,0),(1,0))
Text(0, 0, '')
Text(1, 0, '')

YAxis(80.0,52.8)
Text(0.5, 1.0, '')
Text(0.0, 1.0, '')
Text(1.0, 1.0, '')
Rectangle(xy=(0, 0), width=1, height=1, angle=0)
AxesSubplot(0.125,0.11;0.775x0.77)

