强化学习的遗传算法: Python实现
大多数机器学习初学者都是从学习监督学习技术开始的,例如分类和回归。然而,机器学习中最重要的范式之一是强化学习 (RL),它能够解决许多具有挑战性的任务。它是机器学习的一个方面,代理通过执行某些动作并观察从这些动作中获得的奖励(结果)来学习在环境中的行为。
在强化学习中,我们给机器一些输入和动作,然后根据输出奖励它们。奖励最大化是最终目标。就像一个一开始什么都不懂的小婴儿被单独留在一个环境中,经过一些了解后,往往会了解周围的事物。
在这里,我们只是要根据种群受到病毒攻击时的基因突变来构建一个算法。在我们人口的第一代中,只有少数最适合的人能够生存下来,而随着世代的流逝,新一代人对病毒的抵抗力将比他们的祖先强得多。这是一个基本的算法,它只是让我们了解这些东西是如何工作的。任何具有Python基础知识和一些库(如 numpy、matplotlib 等)的人都可以轻松理解这段代码。这只是为了介绍并提供有关强化学习的表面知识。
遗传算法——
使用的库:
- numpy :我们将使用该库中的 numpy 数组和其他基本计算功能
- matplotlib :我们将使用 matplotlib.pyplot 功能来绘制图形以直观理解算法。
在这个程序中,我们将定义 3 个主要功能,以生成在遗传上比以前更强大的下一代种群。
The three main functions used are:
populate: This is used to generate the population and then appending it to a list. This function accepts the attributes like the number of features in the population and the size of it.
reduction: This function is used to reduce the size of the population and allows only the 100 most fittest ones to survive. These fit ones will be the ones used to generate the next generation of the population.
cross: This function is used for the process of cross-breeding between the ones that are left in order to generate a whole new generation of the population which will be much more immune towards the virus.
下面是实现——
import numpy as np
import matplotlib.pyplot as plt

# specifying the size for each and
# every matplotlib plot globally
plt.rcParams['figure.figsize'] = [8, 6]

# defining list objects with range of the graph
x1_range = [-100, 100]
x2_range = [-100, 100]

# empty list object to store the population
population = []

# this function is used to generate the population
# and appending it to the population list defined above
# it takes the attributes as no. of features in a
# population and size that we have in it
def populate(features, size = 1000):

    # here we are defining the coordinate
    # for each entity in a population
    initial = []

    for _ in range(size):
        entity = []
        for feature in features:

            # this * feature variable unpacks a list
            # or tuple into position arguments.
            val = np.random.randint(*feature)
            entity.append(val)
        initial.append(entity)

    return np.array(initial)

# defining the virus in the form of numpy array
virus = np.array([5, 5])

# only the 100 fit ones will survive in this one
def fitness(population, virus, size = 100):

    scores = []

    # enumerate also provides the index as for the iterator
    for index, entity in enumerate(population):
        score = np.sum((entity-virus)**2)
        scores.append((score, index))

    scores = sorted(scores)[:size]

    return np.array(scores)[:, 1]

# this function is used to plot the graph
def draw(population, virus):
    plt.xlim((-100, 100))
    plt.ylim((-100, 100))
    plt.scatter(population[:, 0], population[:, 1], c ='green', s = 12)
    plt.scatter(virus[0], virus[1], c ='red', s = 60)


def reduction(population, virus, size = 100):

    # only the index of the fittest ones
    # is returned in sorted format
    fittest = fitness(population, virus, size)

    new_pop = []

    for item in fittest:
        new_pop.append(population[item])

    return np.array(new_pop)

# cross mutation in order to generate the next generation
# of the population which will be more immune to virus than previous
def cross(population, size = 1000):

    new_pop = []

    for _ in range(size):
        p = population[np.random.randint(0, len(population))]
        m = population[np.random.randint(0, len(population))]

        # we are only considering half of each
        # without considering random selection
        entity = []
        entity.append(*p[:len(p)//2])
        entity.append(*m[len(m)//2:])

        new_pop.append(entity)

    return np.array(new_pop)

# generating and adding the random features to
# the entity so that it looks more distributed
def mutate(population):

    return population + np.random.randint(-10, 10, 2000).reshape(1000, 2)


# the complete cycle of the above steps
population = populate([x1_range, x2_range], 1000)

# gens is the number of generation
def cycle(population, virus, gens = 1):

    # if we change the value of gens, we'll get
    # next and genetically more powerful generation
    # of the population
    for _ in range(gens):
        population = reduction(population, virus, 100)
        population = cross(population, 1000)
        population = mutate(population)

    return population

population = cycle(population, virus)

draw(population, virus)
输出:
1) 对于第 1 代,当 gens=0 时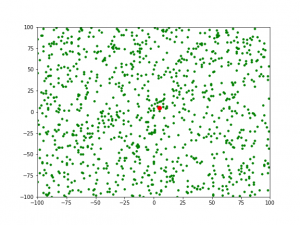
2) 对于第 2 代,当 gens=1 时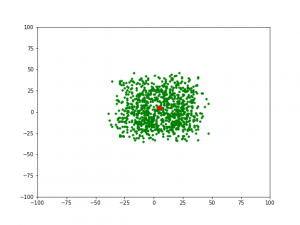
3) 对于第 3 代,当 gens=2 时