Python - 在 Plotly 图表中更改图例大小
图表 Y 轴上的数据,也称为图表系列,反映在图表的图例中。这是来自相关表格报告列的信息,通常由指标组成。图表图例通常显示为图表右侧或左侧的框。
Plotly 的update_layout()函数用于更改 plotly 图表中的图例大小。
句法:
update_layout(dict1=None, overwrite=False, **kwargs)输入 dict / 关键字参数中的值用于迭代地更改原始布局的各个部分。
参数:
- dict1 (dict) – 要更新的是属性字典。
- overwrite (bool) -- 如果为 True,则现有属性将被覆盖。如果为 False,则递归地对现有属性应用更新,保留更新操作中未指定的属性。
- kwargs – 要更新的是属性的关键字/值对。
示例:在编辑大小和字体之前
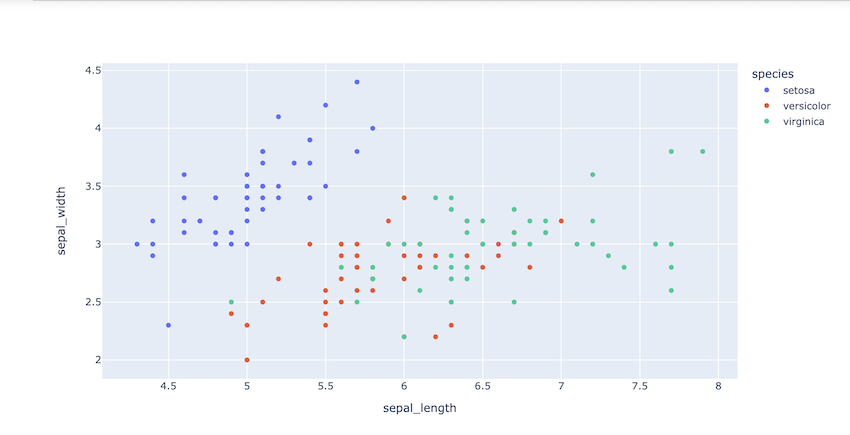
导入包和 CSV。使用 px.scatter() 方法创建一个散点图,并给出 X、Y 和颜色参数。下面的代码是一个简单的散点图,没有格式化图例大小。
要查看和访问 CSV 文件,请单击此处。
Python3
# import packages
import plotly.express as px
import pandas as pd

# importing csv file
df = pd.read_csv("iris.csv")

# scatter plot using plotty
fig = px.scatter(df, x="sepal_length", y="sepal_width",
                 color="species")

fig.show()
Python3
# import packages
import plotly.express as px
import pandas as pd

# importing csv file
df = pd.read_csv("iris.csv")

# scatter plot using plotly
fig = px.scatter(df, x="sepal_length", y="sepal_width", color="species")

# update_layout method used to modify change and size
fig.update_layout(legend=dict(title_font_family="Times New Roman",
                              font=dict(size= 20)
))

fig.show()
输出:
编辑大小和字体后:
导入包和 CSV。使用 px.scatter() 方法创建一个散点图,并给出 X、Y 和颜色参数。下面的代码用于创建修改后的散点图,我们使用 update_layout() 方法为我们的图例提供额外的参数并更改字体系列和字体大小。
Python3
# import packages
import plotly.express as px
import pandas as pd

# importing csv file
df = pd.read_csv("iris.csv")

# scatter plot using plotly
fig = px.scatter(df, x="sepal_length", y="sepal_width", color="species")

# update_layout method used to modify change and size
fig.update_layout(legend=dict(title_font_family="Times New Roman",
                              font=dict(size= 20)
))

fig.show()
输出:
