毫升 |使用逻辑回归预测心脏病。
世界卫生组织估计,五分之四的心血管疾病(CVD)死亡是由于心脏病发作。整个研究旨在确定极有可能受到 CVD 影响的患者比例,并使用逻辑回归预测总体风险。
什么是逻辑回归?
逻辑回归是一种统计和机器学习技术,根据输入字段的值对数据集的记录进行分类。它根据一组或多组自变量预测因变量以预测结果。它既可以用于二分类,也可以用于多分类。要了解更多信息,请单击此处。
代码:加载库。
Python3
import pandas as pd
import pylab as pl
import numpy as np
import scipy.optimize as opt
import statsmodels.api as sm
from sklearn import preprocessing
'exec(% matplotlib inline)'
import matplotlib.pyplot as plt
import matplotlib.mlab as mlab
import seaborn as sn
Python3
# dataset
disease_df = pd.read_csv("../input / framingham.csv")
disease_df.drop(['education'], inplace = True, axis = 1)
disease_df.rename(columns ={'male':'Sex_male'}, inplace = True)

# removing NaN / NULL values
disease_df.dropna(axis = 0, inplace = True)
print(disease_df.head(), disease_df.shape)
print(disease_df.TenYearCHD.value_counts())
Python3
# counting no. of patients affected with CHD
plt.figure(figsize = (7, 5))
sn.countplot(x ='TenYearCHD', data = disease_df,
             palette ="BuGn_r" )
plt.show()
Python3
laste = disease_df['TenYearCHD'].plot()
plt.show(laste)
Python3
X = np.asarray(disease_df[['age', 'Sex_male', 'cigsPerDay',
                           'totChol', 'sysBP', 'glucose']])
y = np.asarray(disease_df['TenYearCHD'])

# normalization of the dataset
X = preprocessing.StandardScaler().fit(X).transform(X)

# Train-and-Test -Split
from sklearn.model_selection import train_test_split
X_train, X_test, y_train, y_test = train_test_split(
        X, y, test_size = 0.3, random_state = 4)
print ('Train set:', X_train.shape,  y_train.shape)
print ('Test set:', X_test.shape,  y_test.shape)
Python3
from sklearn.linear_model import LogisticRegression
logreg = LogisticRegression()
logreg.fit(X_train, y_train)
y_pred = logreg.predict(X_test)

# Evaluation and accuracy
from sklearn.metrics import jaccard_similarity_score
print('')
print('Accuracy of the model in jaccard similarity score is = ',
      jaccard_similarity_score(y_test, y_pred))
Python3
# Confusion matrix
from sklearn.metrics import confusion_matrix, classification_report

cm = confusion_matrix(y_test, y_pred)
conf_matrix = pd.DataFrame(data = cm,
                           columns = ['Predicted:0', 'Predicted:1'],
                           index =['Actual:0', 'Actual:1'])
plt.figure(figsize = (8, 5))
sn.heatmap(conf_matrix, annot = True, fmt = 'd', cmap = "Greens")
plt.show()

print('The details for confusion matrix is =')
print (classification_report(y_test, y_pred))

# This code is contributed by parna_28 .
数据准备:
该数据集可在 Kaggle 网站上公开获得,它来自对马萨诸塞州弗雷明汉镇居民正在进行的心血管研究。分类目标是预测患者未来是否有10 年患冠心病 (CHD) 的风险。数据集提供患者的信息。它包括4,000 多条记录和15 个属性。加载数据集。
Python3
# dataset
disease_df = pd.read_csv("../input / framingham.csv")
disease_df.drop(['education'], inplace = True, axis = 1)
disease_df.rename(columns ={'male':'Sex_male'}, inplace = True)

# removing NaN / NULL values
disease_df.dropna(axis = 0, inplace = True)
print(disease_df.head(), disease_df.shape)
print(disease_df.TenYearCHD.value_counts())
输出 :
Sex_male age currentSmoker ... heartRate glucose TenYearCHD
0 1 39 0 ... 80.0 77.0 0
1 0 46 0 ... 95.0 76.0 0
2 1 48 1 ... 75.0 70.0 0
3 0 61 1 ... 65.0 103.0 1
4 0 46 1 ... 85.0 85.0 0
[5 rows x 15 columns] (3751, 15)
0 3179
1 572
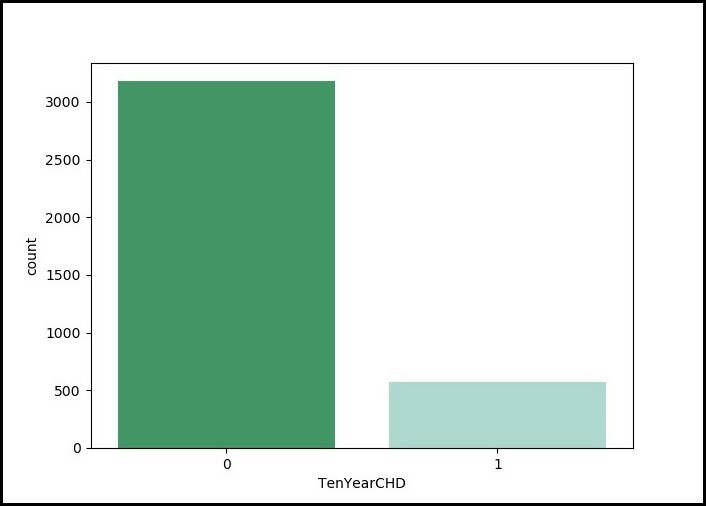
Name: TenYearCHD, dtype: int64代码:数据集中所有可用患者的十年 CHD 记录:
Python3
# counting no. of patients affected with CHD
plt.figure(figsize = (7, 5))
sn.countplot(x ='TenYearCHD', data = disease_df,
             palette ="BuGn_r" )
plt.show()
输出:图表显示:

代码:计算受 CHD 影响的患者人数,其中(0= 未受影响;1= 受影响):
Python3
laste = disease_df['TenYearCHD'].plot()
plt.show(laste)
输出:图形显示:
代码:训练和测试集:拆分数据 |数据集的规范化
Python3
X = np.asarray(disease_df[['age', 'Sex_male', 'cigsPerDay',
                           'totChol', 'sysBP', 'glucose']])
y = np.asarray(disease_df['TenYearCHD'])

# normalization of the dataset
X = preprocessing.StandardScaler().fit(X).transform(X)

# Train-and-Test -Split
from sklearn.model_selection import train_test_split
X_train, X_test, y_train, y_test = train_test_split(
        X, y, test_size = 0.3, random_state = 4)
print ('Train set:', X_train.shape,  y_train.shape)
print ('Test set:', X_test.shape,  y_test.shape)
输出 :
Train Set :
(2625, 6) (2625, )

Test Set :
(1126, 6) (1126, )
代码:数据集建模 |评估和准确性:
Python3
from sklearn.linear_model import LogisticRegression
logreg = LogisticRegression()
logreg.fit(X_train, y_train)
y_pred = logreg.predict(X_test)

# Evaluation and accuracy
from sklearn.metrics import jaccard_similarity_score
print('')
print('Accuracy of the model in jaccard similarity score is = ',
      jaccard_similarity_score(y_test, y_pred))
输出 :
Accuracy of the model in jaccard similarity score is = 0.8490230905861457代码:使用混淆矩阵找到模型的准确性:
Python3
# Confusion matrix
from sklearn.metrics import confusion_matrix, classification_report

cm = confusion_matrix(y_test, y_pred)
conf_matrix = pd.DataFrame(data = cm,
                           columns = ['Predicted:0', 'Predicted:1'],
                           index =['Actual:0', 'Actual:1'])
plt.figure(figsize = (8, 5))
sn.heatmap(conf_matrix, annot = True, fmt = 'd', cmap = "Greens")
plt.show()

print('The details for confusion matrix is =')
print (classification_report(y_test, y_pred))

# This code is contributed by parna_28 .
输出 :
The details for confusion matrix is =
              precision    recall  f1-score   support

           0       0.85      0.99      0.92       951
           1       0.61      0.08      0.14       175

    accuracy                           0.85      1126
   macro avg       0.73      0.54      0.53      1126
weighted avg       0.82      0.85      0.80      1126
混淆矩阵:
