📌 相关文章
- 基准测试(1)
- 基准测试
- Julia 中的基准测试(1)
- Julia 中的基准测试
- Julia 中的基准测试(1)
- Julia 中的基准测试
- Redis基准测试(1)
- Redis基准测试
- 测试加载函数基准 javascript (1)
- 软件测试中的基准测试(1)
- 软件测试中的基准测试
- 测试加载函数基准 javascript 代码示例
- apache 基准测试示例 - Shell-Bash (1)
- java 基准测试时间 - Java (1)
- Golang 基准测试概述(1)
- Golang 基准测试概述
- apache 基准测试示例 - Shell-Bash 代码示例
- java 基准测试时间 - Java 代码示例
- 基准测试和性能分析
- 基准测试和性能分析(1)
- optaplanner 基准测试 (1)
- Redis-基准
- Redis-基准(1)
- CodeIgniter库
- CodeIgniter-库(1)
- CodeIgniter-库
- 像 codeigniter (1)
- CodeIgniter库(1)
- optaplanner 基准测试 - 任何代码示例
📜 CodeIgniter-基准测试
📅 最后修改于: 2020-10-26 05:35:43 🧑 作者: Mango
设定基准点
如果要测量执行一组行或内存使用量所花费的时间,可以使用CodeIgniter中的基准测试点进行计算。为此,CodeIgniter中有一个单独的“ Benchmarking ”类。
此类自动加载;您不必加载它。它可以在控制器,视图和模型类中的任何位置使用。您要做的就是标记一个起点和终点,然后在这两个标记的点之间执行elapsed_time()函数,您可以获得执行该代码所花费的时间,如下所示。
benchmark->mark('code_start');

   // Some code happens here

   $this->benchmark->mark('code_end');

   echo $this->benchmark->elapsed_time('code_start', 'code_end');
?>
要显示内存使用情况,请使用函数memory_usage() ,如以下代码所示。
benchmark->memory_usage();
?>
例
创建一个名为Profiler_controller.php的控制器,并将其保存在application / controller / Profiler_controller.php中
output->enable_profiler(TRUE);
         $this->load->view('test');
      }

      public function disable() {

         //disable profiler
         $this->output->enable_profiler(FALSE);
         $this->load->view('test');
      }

   }
?>
创建一个名为test.php的视图文件,并将其保存在application / views / test.php中
      CodeIgniter View Example


      CodeIgniter View Example
更改位于application / config / routes.php的routes.php文件,以为上述控制器添加路由,并在文件末尾添加以下行。
$route['profiler'] = "Profiler_controller";
$route['profiler/disable'] = "Profiler_controller/disable"
之后,您可以在浏览器的地址栏中键入以下URL以执行示例。
http://yoursite.com/index.php/profiler
上面的URL将启用探查器,并将产生输出,如以下屏幕截图所示。
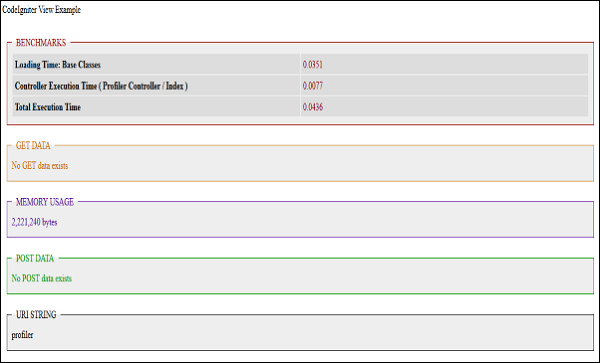
要禁用分析,请执行以下URL。
http://yoursite.com/index.php/profiler/disable