Pygal 中的图形样式
Pygal是一个Python模块,主要用于构建 SVG(Scalar Vector Graphics)图形和图表。 SVG 是 XML 格式的基于矢量的图形,可以在任何编辑器中进行编辑。 Pygal 可以用最少的代码行来创建易于理解和编写的图形。
Pygal 是Python模块,它在 pygal.style 类下提供了 14 种内置样式,如下所示:
- 深色风格
- 霓虹风格
- DarkSolarizedStyle
- LightSolarizedStyle
- 灯光风格
- 清洁风格
- 红蓝风格
- DarkColorizedStyle
- 浅色风格
- 绿松石风格
- 浅绿色风格
- 深绿色风格
- 深绿色蓝色风格
- 蓝色风格
注意:任何图形都可以通过在样式参数中传递样式名称来使用这些样式设置样式。
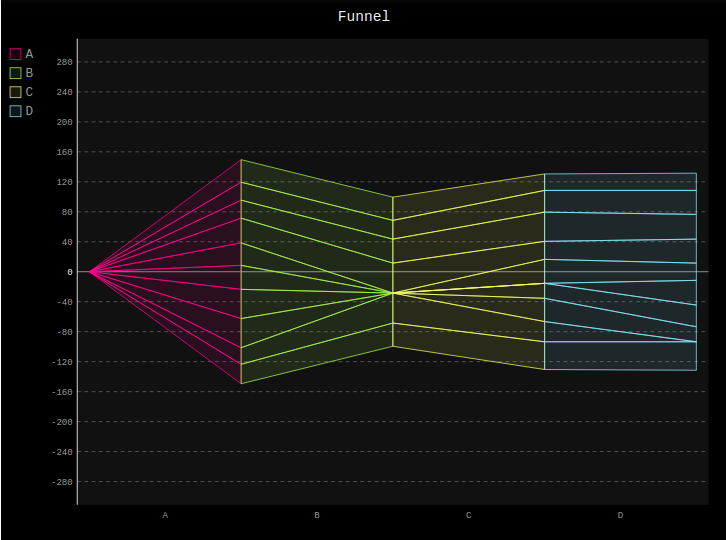
示例 1:样式漏斗图
Python3
# importing pygal
import pygal
from pygal.style import NeonStyle

# creating the chart object
funnel = pygal.Funnel(style = NeonStyle)

# naming the title
funnel.title = 'Funnel'

# Random data
funnel.add('A', [26, 22, 39, 39, 32, 30, 33, 24, 24, 30])
funnel.add('B', [31, 40, None, None, None, None, 40, 32, 25, 31])
funnel.add('C', [37, 27, 31, 20, None, 32, 24, 39, 29, 22])
funnel.add('D', [38, None, 20, 29, 33, 23, 32, 33, 32, 23])

funnel
Python3
# importing pygal
import pygal
from pygal.style import LightSolarizedStyle

# creating the chart object
line = pygal.StackedLine(fill = True, style = LightSolarizedStyle)

# naming the title
line.title = 'Stacked Line'

# Random data
line.add('A', [26, 22, 39, 39, 32, 30, 33, 24, 24, 30])
line.add('B', [31, 40, None, None, None, None, 40, 32, 25, 31])
line.add('C', [37, 27, 31, 20, None, 32, 24, 39, 29, 22])
line.add('D', [38, None, 20, 29, 33, 23, 32, 33, 32, 23])

line
Python3
# importing pygal
import pygal
from pygal.style import BlueStyle

# creating the chart object
bar = pygal.Bar(fill = True, style = BlueStyle)

# naming the title
bar.title = 'Bar Chart'

# Random data
bar.add('A', [26, 22, 39, 39, 32, 30, 33, 24, 24, 30])
bar.add('B', [31, 40, None, None, None, None, 40, 32, 25, 31])
bar.add('C', [37, 27, 31, 20, None, 32, 24, 39, 29, 22])
bar.add('D', [38, None, 20, 29, 33, 23, 32, 33, 32, 23])

bar
输出:
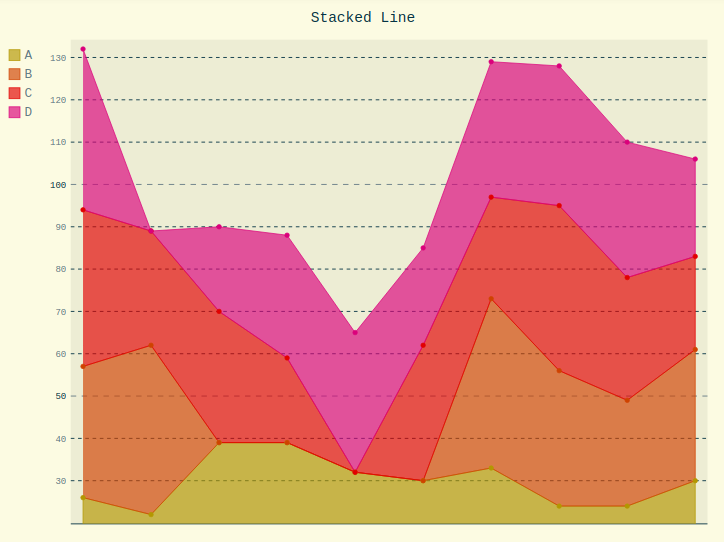
示例 2:样式堆积折线图
Python3
# importing pygal
import pygal
from pygal.style import LightSolarizedStyle

# creating the chart object
line = pygal.StackedLine(fill = True, style = LightSolarizedStyle)

# naming the title
line.title = 'Stacked Line'

# Random data
line.add('A', [26, 22, 39, 39, 32, 30, 33, 24, 24, 30])
line.add('B', [31, 40, None, None, None, None, 40, 32, 25, 31])
line.add('C', [37, 27, 31, 20, None, 32, 24, 39, 29, 22])
line.add('D', [38, None, 20, 29, 33, 23, 32, 33, 32, 23])

line
输出:
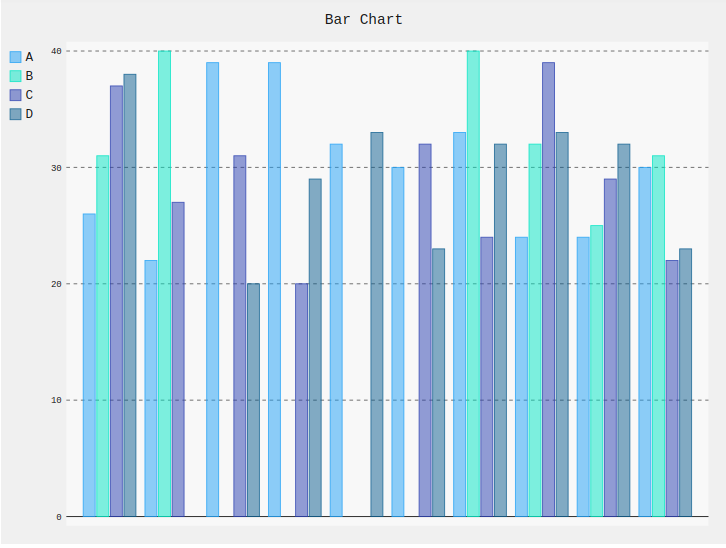
示例 3:样式条形图
Python3
# importing pygal
import pygal
from pygal.style import BlueStyle

# creating the chart object
bar = pygal.Bar(fill = True, style = BlueStyle)

# naming the title
bar.title = 'Bar Chart'

# Random data
bar.add('A', [26, 22, 39, 39, 32, 30, 33, 24, 24, 30])
bar.add('B', [31, 40, None, None, None, None, 40, 32, 25, 31])
bar.add('C', [37, 27, 31, 20, None, 32, 24, 39, 29, 22])
bar.add('D', [38, None, 20, 29, 33, 23, 32, 33, 32, 23])

bar
输出: