MATLAB 中的 3D 绘图
在 MATLAB 中,我们可以绘制不同类型的模块,例如 2d 绘图和 3d 绘图。在本文中,我们将看到各种类型的 3D 绘图。
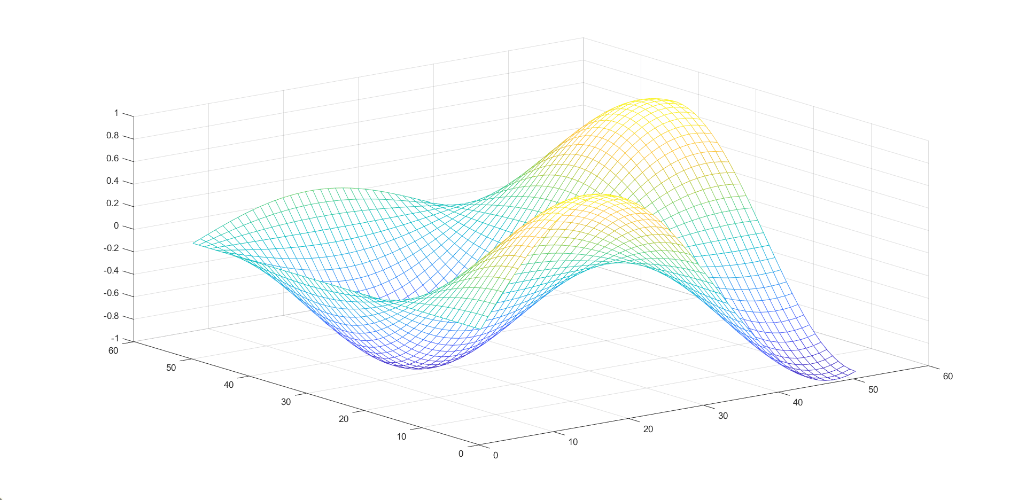
- 网格图:网格图是一个 3d 表面,它为不同类型的表达创建不同类型的网格。要创建网格,我们必须为 z 提供 x 和 y 值,(z= f(x, y))。为了绘制网格图,它具有 mesh() 将生成 3d 表面。它具有纯边缘颜色但没有面颜色。
句法:
mesh(Z)例子:
Matlab
% give the input of x and y.
[x,y]= meshgrid(0:0.1:5);

% give the expression for x
% and y for the output in z
z= sin(x).*cos(y);

% mesh() is used for 3D plotting
mesh(z);
Matlab
% give the input for x and y
[x,y]= meshgrid(0:0.1:5);

% give the expression for
% x and y for the value of z.
z= sin(x).*cos(y);

% use surf() for the plotting
surf(z)
Matlab
% give the input for x and y
[x,y]= meshgrid(0:0.1:5);

% give the expression for x and y
% for the value of z
z= sin(x).*cos(y);

% use surfl() for the plotting
% shading faceted is by default
surfl(z)
shading faceted
title('Faceted Shading')

% use shading flat for each mesh
% line segment and face has a
% constant color
surfl(z)
shading flat
title('Flat Shading')

% use shading flat for varies the
% color in each line segment and
% face by interpolating
surfl(z)
shading interp
title('Interpolated Shading')
Matlab
% enter the inputs of x and y
[x,y]= meshgrid(0:0.1:5);

% enter the expression using
% x and y
z= sin(x).*cos(y);

% use contour() for plotting
contour3(z,50)
Matlab
% give the input value for x,
% y and z
[x,y,z]= meshgrid(0:0.1:5);

% using x, y and z give the
% values for u,v and w
u= sin(x).*cos(y);
v= sin(x).*cos(y);
w= sin(x).*cos(y);

%use quiver3() for 3d plotting
quiver3(x,y,z,u,v,w);
输出:
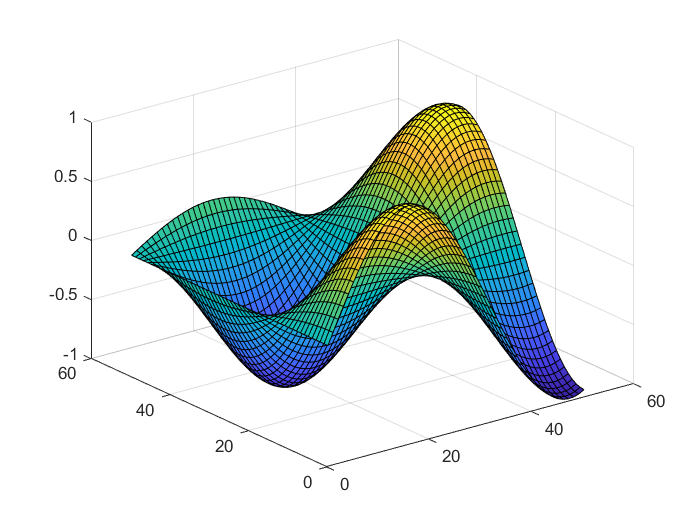
- 曲面图:曲面图是一个 3d 曲面,可为不同的表达式创建不同类型的曲面。要创建一个曲面,我们必须为 z 提供 x 和 y 值,(z= f(x, y))。为了绘制曲面图,它具有 surf() 将生成 3d 曲面。它具有纯色边缘和纯色面
句法:
surf(Z)例子:
MATLAB
% give the input for x and y
[x,y]= meshgrid(0:0.1:5);

% give the expression for
% x and y for the value of z.
z= sin(x).*cos(y);

% use surf() for the plotting
surf(z)
输出:
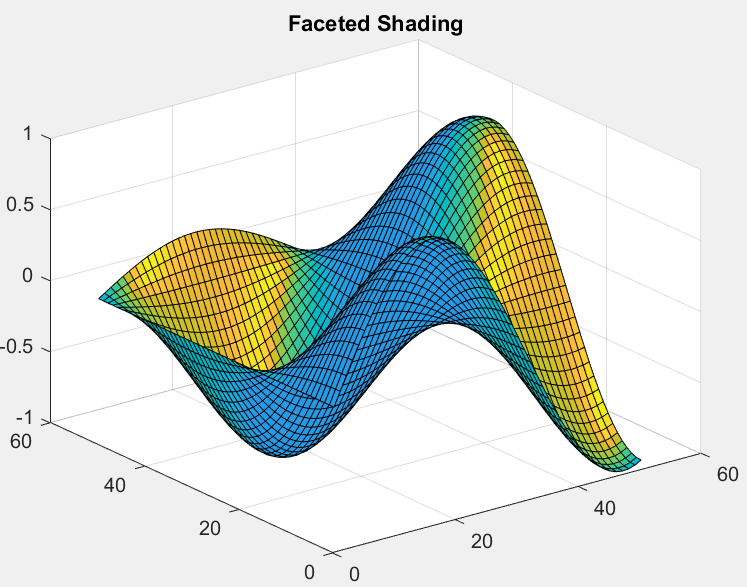
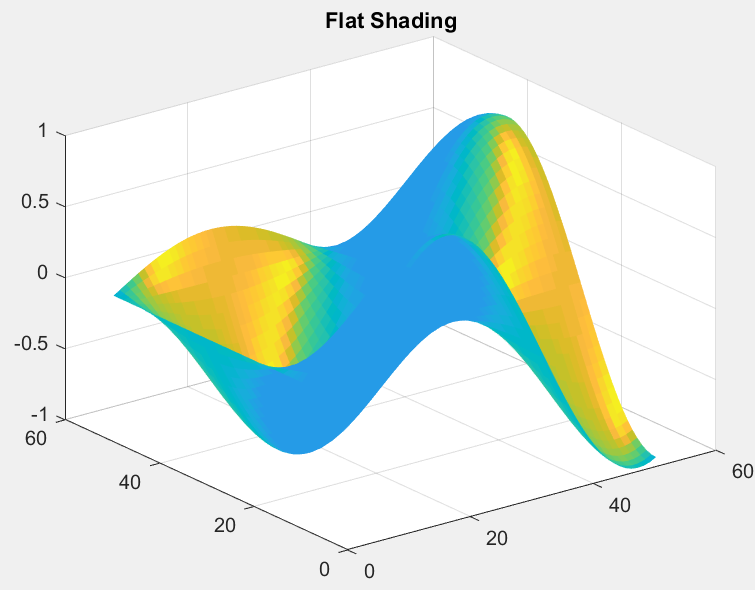
- Surface plot(with shading):创建具有纯边缘颜色和纯面颜色并且还具有阴影的三维表面图的表面图。在带阴影的表面中,我们必须给出 z 的 x 和 y 值,(z= f(x, y))。为了绘制表面图,它具有用于 3d 绘图的 surf(z)。
句法:
surfl(z)有三种类型的阴影可用:
- 阴影平面
- 阴影面
- 阴影插值
例子:
MATLAB
% give the input for x and y
[x,y]= meshgrid(0:0.1:5);

% give the expression for x and y
% for the value of z
z= sin(x).*cos(y);

% use surfl() for the plotting
% shading faceted is by default
surfl(z)
shading faceted
title('Faceted Shading')

% use shading flat for each mesh
% line segment and face has a
% constant color
surfl(z)
shading flat
title('Flat Shading')

% use shading flat for varies the
% color in each line segment and
% face by interpolating
surfl(z)
shading interp
title('Interpolated Shading')
输出:

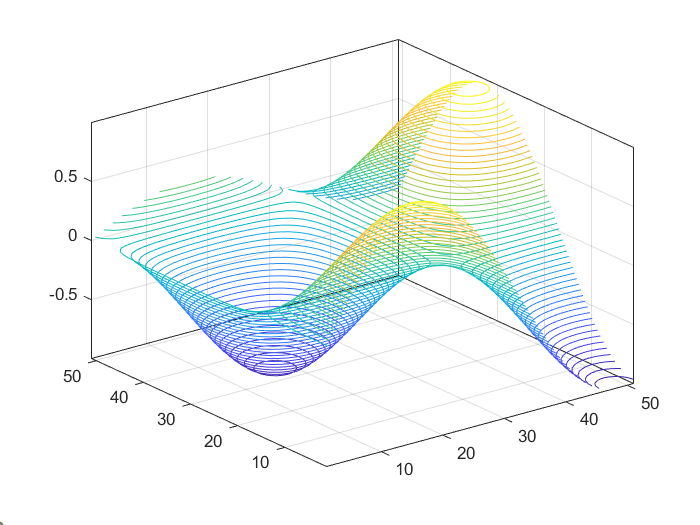
- 等高线图:等高线图也称为线图。要绘制等高线,它具有 x, y 变量,用于给出 z (z=f(x, y)) 的值。 x 和 y 变量通常位于称为 meshgrid 的网格中。
句法:
contour(Z)例子:
MATLAB
% enter the inputs of x and y
[x,y]= meshgrid(0:0.1:5);

% enter the expression using
% x and y
z= sin(x).*cos(y);

% use contour() for plotting
contour3(z,50)
输出:
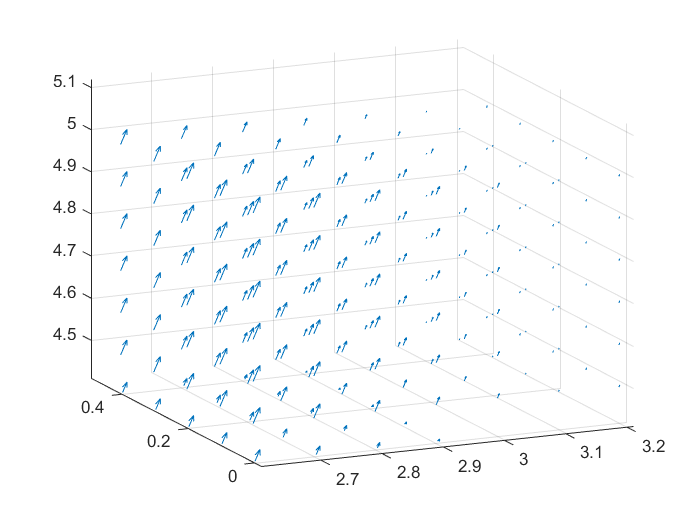
- 箭袋图:箭袋图或矢量图是一种绘图,它使用笛卡尔分量 x、y 和 z 给出 u、v、w 的方向分量。要绘制箭袋图,请使用 quiver3()。
句法:
quiver3(X, Y, Z, U, V, W)例子:
MATLAB
% give the input value for x,
% y and z
[x,y,z]= meshgrid(0:0.1:5);

% using x, y and z give the
% values for u,v and w
u= sin(x).*cos(y);
v= sin(x).*cos(y);
w= sin(x).*cos(y);

%use quiver3() for 3d plotting
quiver3(x,y,z,u,v,w);
输出: