📌 相关文章
- MATLAB 3D slice()(1)
- MATLAB 3D slice()
- python中的3d饼图(1)
- 图 3d python (1)
- MATLAB 3D Ribbon()(1)
- MATLAB 3D Ribbon()
- MATLAB 3D surf()(1)
- MATLAB 3D surf()
- 在 MATLAB 中绘制 3D 轮廓
- 在 MATLAB 中绘制 3D 轮廓(1)
- : 在 matlab (1)
- MATLAB 2-D图
- 根 matlab (1)
- MATLAB中的饼图
- matlab 轴 - Matlab (1)
- MATLAB中的饼图(1)
- MATLAB 2-D图(1)
- MATLAB 3D mesh()(1)
- MATLAB 3D mesh()
- MATLAB 3D sphere()(1)
- MATLAB 3D sphere()
- 两点 3D 距离 matlab (1)
- MATLAB 3D Waterfall()(1)
- MATLAB 3D Waterfall()
- matlab 轴 - Matlab 代码示例
- python代码示例中的3d饼图
- 图 3d python 代码示例
- MATLAB 3D ellipsoid()
- MATLAB 3D meshz()
📜 MATLAB 3D图
📅 最后修改于: 2021-01-07 02:51:40 🧑 作者: Mango
MATLAB 3D图
MATLAB还包含各种三维图,这些图对于显示某些类型的数据很有用。通常,三维图有助于显示两种类型的数据:
- 当您希望强调自变量的重要性时,这两个变量是同一自变量的函数。
- 一个由两个独立变量z = f(x,y)构成的函数的变量。
为了获得z,首先,我们必须使用meshgrid函数创建一组(x,y)点。
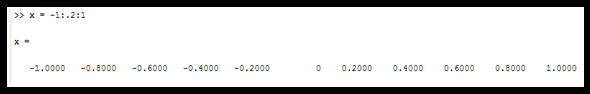
[X,Y] = meshgrid(-1:.2:1);
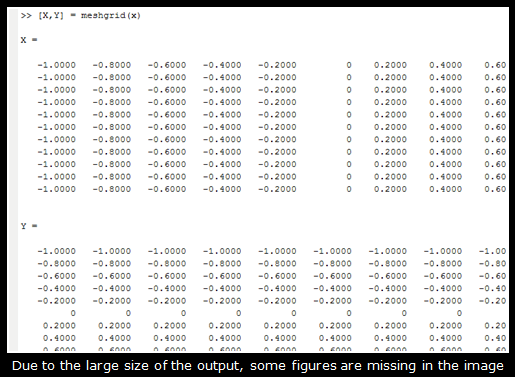
此处,函数meshgrid中的参数是一个向量,使用冒号运算符创建(开始:步骤:结束)
meshgrid函数最多可以包含三个向量参数,并根据参数中向量的坐标返回二维坐标。
网格功能
| Grid coordinates set (matrix) | Function | Vector coordinates | Grid length |
|---|---|---|---|
| [X,Y], X & Y are matrices, where each row is a copy of x, and each column is a copy of y respectively. |
=meshgrid(x,y), returns 2-D grid coordinates based on x & y | Coordinates of Vector x and y | No. of rows in X & Y = length(y), No. of columns in X & Y = length(x) |
| [X,Y], X & Y are matrices, where each row and column is a copy of x. |
=meshgrid(x), equivalent to meshgrid(x,x), and returns square 2-D grid coordinates based on x | Coordinates of Vector x | Grid size = length(x) by length(x) |
| [X, Y, Z], X have coordinates of x, Y have coordinates of y, and Z have coordinates of z | =meshgrid(x,y,z), returns 3-D grid coordinates based on vectors x, y, & z | Coordinates of Vectors x, y, and z. | Grid size = length(y) by length(x) by length(z) |
| [X,Y,Z], All have same coordinates of x |
=meshgrid(x), is same as meshgrid(x,y,z) in the form of meshgrid(x,x,x) | Coordinates of Vector x | 3-D grid size = lenght(x) by length(x) by length(x) |
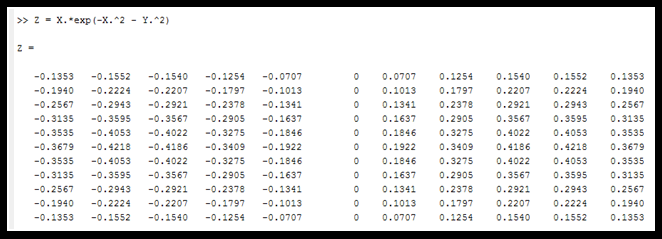
现在评估Z以创建3-D图:
Z = X. * exp(-X。^ 2-Y. ^ 2); %点。运算符用于执行逐元素计算。
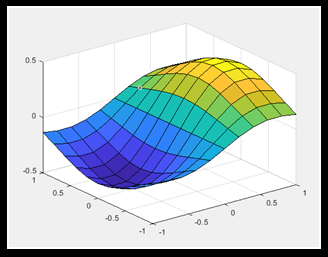
现在,我们将使用函数surf(X,Y,Z)创建一个3-D表面图。
通过输入surf函数,它将生成3-D表面图。
- surf(X,Y,Z)函数创建3D表面图。
- 矩阵Z的值用作xy平面中网格上方的高度。
- 该函数还将Z用于与高度成比例的颜色数据。
- 还有一个函数, mesh ,它还可以显示三维表面。
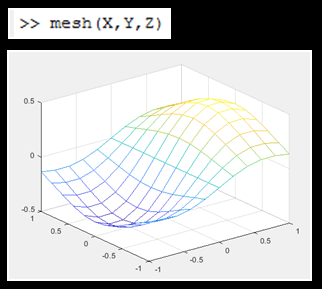
- 冲浪和网格功能之间的主要区别在于,冲浪以彩色显示连接线和曲面的表面,而网格函数生成线框曲面。网格函数不会为整个表面着色;它仅对连接定义点的线着色。