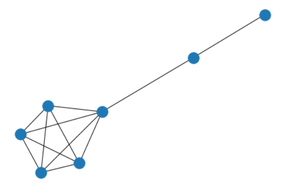
棒棒糖图由 2 个组件组成,一个称为 clique 的完整图和一个路径图。更准确地说,L (m ,n)是具有 m 节点完全图和 n 节点路径图的图。
L (4,2)棒棒糖图:

L (4,2)图
下面让我们看看这个图的属性:
|
So.no |
Properties of Lollipop Graph: |
|---|---|
|
1 |
It is a connected graph with two components clique and path graph. |
|
2 |
The number of vertices is m + n. |
|
3 |
The number of edges=Number of edges in complete graph+ Number of edges in path graph. |
|
4 |
The number of edges=m(m-1)/2 + n. |
|
5 |
Diameter of lollipop graph = n+1. |
|
6 |
It is a cyclic graph as cycles are contained in a clique of the lollipop graph. |
|
7 |
It is like a barbell graph without one of the barbells. |
|
8 |
For the complete graph’s nodes are labeled from 0 to m-1. |
|
9 |
And m to m+n-1 for the path graph. |
|
10 |
Complete graph and path graph are joined via an edge (m – 1, m). |
我们将使用networkx模块来实现棒棒糖图。它带有一个内置函数networkx.lollipop_graph() 并且可以使用 networkx.draw() 方法进行说明。 Python的这个模块用于可视化和分析不同类型的图形。
Syntax: networkx.lollipop_graph(m,n)
Parameters:
- M: Number of nodes in complete graph(clique)
- N: Number of nodes in path graph.
networkx.draw(G, node_size, node_color)
- Used to realize the graph by passing graph object.
- G: It refers to the Tutte graph object
- node_size: It refers to the size of nodes.
- node_color: It refers to color of the nodes.
示例 1:创建一个简单的棒棒糖图
方法:
- 我们将导入所需的模块网络
- 然后我们将使用 networkx.lollipop_graph(m,n) 创建一个图形对象。
- 为了实现图形,我们将使用 networkx.draw(G, node_color=’green’)
- 三个参数,第一个是图形对象,另外两个用于设置节点的颜色和大小。
代码:
Python3
# import required module
import networkx
# create object
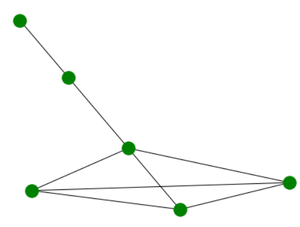
G = networkx.lollipop_graph(4, 2)
# illustrate graph
networkx.draw(G, node_color='green')Python3
# import required module
import networkx

# create object
G = networkx.lollipop_graph(6, 2)

# illustrate graph
networkx.draw(G, node_color='green',
              node_size=1500)
Python3
# importing networkx
import networkx as nx


def lollipop_graph(m, n):

    # the complete graph part.
    G = nx.complete_graph(m)

    # adding path graph edges.
    G.add_nodes_from([v for v in range(m, m+n)])
    if n > 1:

        # joining adjacent path graph edges.
        G.add_edges_from([(v, v+1) for v in range(m, m + n - 1)])

    # connect complete graph to path graph
    if m > 0:
        G.add_edge(m - 1, m)
    return G


# invoking the function defined.
G = lollipop_graph(5, 2)
nx.draw(G)
输出:
示例 2:更改节点的大小。
方法:
- 我们将导入所需的模块网络。
- 然后我们将使用 networkx.lollipop_graph(m,n) 创建一个图形对象。
- 为了实现图形,我们将使用 networkx.draw(G, node_color=’green’,node_size=1500)
- 请注意,这里我们在 draw函数传递了一个额外的参数,即 node_size。
- 这个额外的参数决定了节点的相对大小。
代码:
蟒蛇3
# import required module
import networkx

# create object
G = networkx.lollipop_graph(6, 2)

# illustrate graph
networkx.draw(G, node_color='green',
              node_size=1500)
输出:

示例 3:在不使用 lollipop_graph()函数的情况下创建 Lollipop 图。
方法:
- 我们将所需的模块 networkx 导入为 nx。
- 然后我们将手动定义 lollipop_graph函数。
- 我们将首先使用 complete_graph函数创建完整的图。
- 然后我们将编号从 m 到 m+n-1 的 n 个节点将来自棒棒糖的直线部分
- 然后我们将相邻的节点加入,完成棒棒糖的路径图部分。
- 最后我们将两个不相交的部分连接起来以获得最终结果。
- 请注意,两个 if 条件用于检查是否需要添加任一部分中的节点数或该部分是否为空。
代码:
蟒蛇3
# importing networkx
import networkx as nx


def lollipop_graph(m, n):

    # the complete graph part.
    G = nx.complete_graph(m)

    # adding path graph edges.
    G.add_nodes_from([v for v in range(m, m+n)])
    if n > 1:

        # joining adjacent path graph edges.
        G.add_edges_from([(v, v+1) for v in range(m, m + n - 1)])

    # connect complete graph to path graph
    if m > 0:
        G.add_edge(m - 1, m)
    return G


# invoking the function defined.
G = lollipop_graph(5, 2)
nx.draw(G)
输出: