葡萄酒质量预测——机器学习
在这里,我们将根据特征来预测葡萄酒的质量。我们使用来自 Kaggle 的葡萄酒质量数据集。该数据集具有影响葡萄酒质量的基本特征。通过使用多种机器学习模型,我们将预测葡萄酒的质量。这里我们只处理白葡萄酒的质量,我们使用分类技术来进一步检查葡萄酒的质量,即它是好还是床。
数据集:这里
数据集描述:
在这个数据集中,类是有序的,但并不平衡。在这里,红葡萄酒实例的出现率很高,而白葡萄酒实例的出现率低于红葡萄酒。
这些是数据集中特征的名称 -:
- 类型
- 固定酸度
- 挥发性酸度
- 柠檬酸
- 残糖
- 氯化物
- 游离二氧化硫
- 二氧化硫总量
- 密度
- 酸碱度
- 硫酸盐
- 酒精
- 质量
导入重要的库:
Python3
# import libraries

import pandas as pd
import numpy as np
import matplotlib.pyplot as plt
import seaborn as sb
Python3
# loading the data
Dataframe = pd.read_csv(R'D:\\xdatasets\winequalityN.csv')
Python3
# show rows and columns
Dataframe.head()
Python3
# getting info.
Dataframe.info()
Python3
Dataframe.describe()Python3
# null value check
Dataframe.isnull().sum()
Python
# plot pairplot
sb.pairplot(Dataframe)
#show graph
plt.show()
Python3
#plot histogram
Dataframe.hist(bins=20,figsize=(10,10))
#plot showing
plt.show()
Python3
plt.figure(figsize=[15,6])
plt.bar(df['quality'],df['alcohol'])
plt.xlabel('quality')
plt.ylabel('alcohol')
plt.show()
Python3
# correlation by visualization
plt.figure(figsize=[18,7])
# plot correlation
sb.heatmap(Dataframe.corr(),annot=True)
plt.show()
Python3
colm = []
# loop for columns
for i in range(len(Dataframe.corr().keys())):
# loop for rows
  for j in range(j):
    if abs(Dataframe.corr().iloc[i,j]) > 0.7:
      colm = Dataframe.corr().columns[i]
Python3
# drop column
new_df = Dataframe.drop('total sulfur dioxide',axis = 1)
Python
new_df.update(new_df.fillna(new_df.mean()))Python3
# no of categorical columns
cat = new_df.select_dtypes(include='O')
# create dummies of categorical columns
df_dummies = pd.get_dummies(new_df,drop_first = True)
print(df_dummies)
Python3
df_dummies['best quality']=[1 if x>=7 else 0 for x in Dataframe.quality]
print(df_dummies)
Python3
# import libraries
from sklearn.preprocessing import train_test_split

# independent variables
x = df_dummies.drop(['quality','best quality'],axis=1)
# dependent variable
y = df_dummies['best quality']

# creating train test splits
xtrain,xtest,ytrain,ytest = train_test_split(x,y,test_size=0.2,random_state=40)
Python3
# code
# import libraries

from sklearn.preprocessing import MinMaxScaler
# creating scaler scale var.
norm = MinMaxScaler()
# fit the scale
norm_fit = norm.fit(xtrain)
# transformation of training data
scal_xtrain = norm_fit.transform(xtrain)
# transformation of testing data
scal_xtest = norm_fit.transform(xtest)
print(scal_xtrain)
Python3
# code
#import libraries
from sklearn.ensemble import RandomForestClassifier

# for error checking
from sklearn.matrics import mean_squared_error

from sklearn.metrics import classification_report

# create model variable
rnd = RandomForestClassifier()

# fit the model
fit_rnd = rnd.fit(new_xtrain,ytrain)

# checking the accuracy score
rnd_score = rnd.score(new_xtest,ytest)

print('score of model is : ',rnd_score)

print('.................................')

print('calculating the error')

# checking mean_squared error
MSE = mean_squared_error(ytest,y_predict)

# checking root mean squared error
RMSE = np.sqrt(MSE)

print('mean squared error is : ',MSE)

print('root mean squared error is : ',RMSE)

print(classification_report(ytest,x_predict))
Python3
# code
x_predict = list(rnd.predict(xtest))
df = {'predicted':x_predict,'orignal':ytest}
pd.DataFrame(df).head(10)Pandas是一个有用的数据分析库, Numpy库用于处理数组, Seaborn和Matplotlib用于数据可视化。
读取数据:
蟒蛇3
# loading the data
Dataframe = pd.read_csv(R'D:\\xdatasets\winequalityN.csv')
Pandas read_csv函数用于读取 csv 文件。
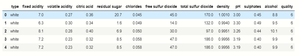
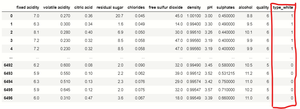
数据检查:
蟒蛇3
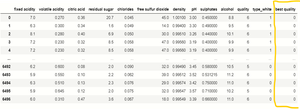
# show rows and columns
Dataframe.head()
输出:
蟒蛇3
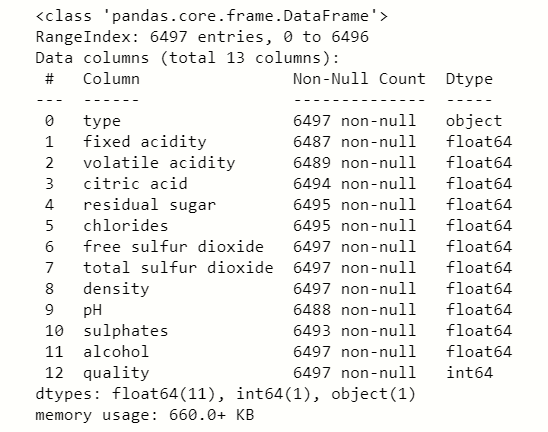
# getting info.
Dataframe.info()
输出:
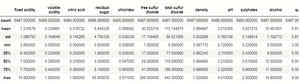
蟒蛇3
Dataframe.describe()
输出:
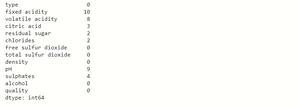
检查空值:
蟒蛇3
# null value check
Dataframe.isnull().sum()
输出:
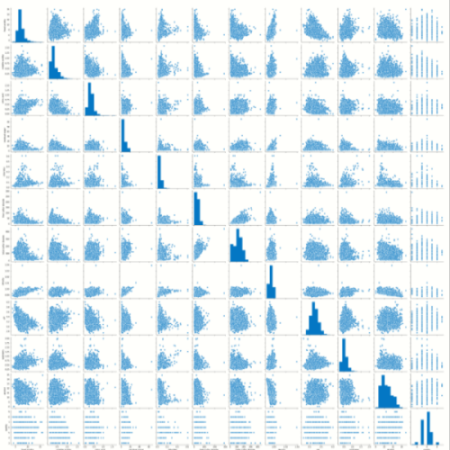
数据可视化:
Python
# plot pairplot
sb.pairplot(Dataframe)
#show graph
plt.show()
输出:
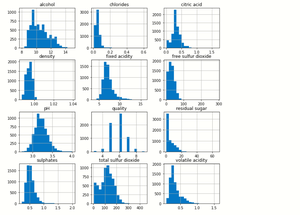
蟒蛇3
#plot histogram
Dataframe.hist(bins=20,figsize=(10,10))
#plot showing
plt.show()
输出:
蟒蛇3
plt.figure(figsize=[15,6])
plt.bar(df['quality'],df['alcohol'])
plt.xlabel('quality')
plt.ylabel('alcohol')
plt.show()
输出:
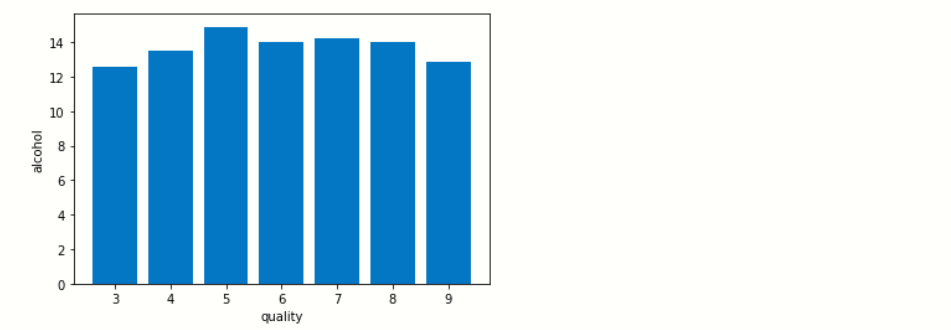
秒
我们检查葡萄酒的质量如何随着葡萄酒中酒精含量的增加而增加。
检查相关性:
这里我们使用统计方法来评估两个定量变量之间关系的结合强度。
蟒蛇3
# correlation by visualization
plt.figure(figsize=[18,7])
# plot correlation
sb.heatmap(Dataframe.corr(),annot=True)
plt.show()
输出:

从这个相关性可视化中,我们将发现哪些特征与其他特征相关。所以我们将使用Python程序来查找这些功能。
蟒蛇3
colm = []
# loop for columns
for i in range(len(Dataframe.corr().keys())):
# loop for rows
  for j in range(j):
    if abs(Dataframe.corr().iloc[i,j]) > 0.7:
      colm = Dataframe.corr().columns[i]
通过这些代码,我们会发现“总二氧化硫”的相关性大于 0.7 值,因此我们删除此列。
蟒蛇3
# drop column
new_df = Dataframe.drop('total sulfur dioxide',axis = 1)
填充空值:
我们用特定特征的平均值填充所有空值,并使用update()方法直接更新数据集。
Python
new_df.update(new_df.fillna(new_df.mean()))
处理分类列:
蟒蛇3
# no of categorical columns
cat = new_df.select_dtypes(include='O')
# create dummies of categorical columns
df_dummies = pd.get_dummies(new_df,drop_first = True)
print(df_dummies)
我们使用熊猫get_dummies() 用于处理分类列的函数,在此数据集中的“类型”特征包含红色和白色两种类型,因此get_dummies()函数将其转换为二进制格式,因为计算机不理解对象类型。因为红葡萄酒是1,白葡萄酒是0。
从属和独立特征:
基本上,我们将使用分类技术将我们的模型拟合到数据集中以获得更好的准确性,因此我们将对依赖特征进行一些根本性的改变。
蟒蛇3
df_dummies['best quality']=[1 if x>=7 else 0 for x in Dataframe.quality]
print(df_dummies)
我们创建了一个程序,其中如果依赖特征“质量”值大于 7,则将其视为1 ,如果它们小于 7,则将其视为0 ,并将其存储在新创建的列“最佳”中质量” 。
将数据集拆分为训练和测试:
蟒蛇3
# import libraries
from sklearn.preprocessing import train_test_split

# independent variables
x = df_dummies.drop(['quality','best quality'],axis=1)
# dependent variable
y = df_dummies['best quality']

# creating train test splits
xtrain,xtest,ytrain,ytest = train_test_split(x,y,test_size=0.2,random_state=40)
数值特征的归一化:
我们将使用归一化技术来缩放我们的数据,因为在我们的特征中数据范围很大,因此该技术平衡了 0 和 1 之间的范围。
蟒蛇3
# code
# import libraries

from sklearn.preprocessing import MinMaxScaler
# creating scaler scale var.
norm = MinMaxScaler()
# fit the scale
norm_fit = norm.fit(xtrain)
# transformation of training data
scal_xtrain = norm_fit.transform(xtrain)
# transformation of testing data
scal_xtest = norm_fit.transform(xtest)
print(scal_xtrain)
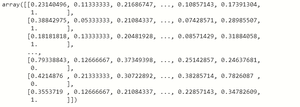
转换后的训练和测试数据自动转换成n维数组的形式。
应用模型:
我们将应用多个回归和分类模型来检查准确度分数,但与其他模型相比, RandomForestClassifier为我们提供了最佳准确度,因此我们使用 RandomForestClassifier。
随机森林分类器:
蟒蛇3
# code
#import libraries
from sklearn.ensemble import RandomForestClassifier

# for error checking
from sklearn.matrics import mean_squared_error

from sklearn.metrics import classification_report

# create model variable
rnd = RandomForestClassifier()

# fit the model
fit_rnd = rnd.fit(new_xtrain,ytrain)

# checking the accuracy score
rnd_score = rnd.score(new_xtest,ytest)

print('score of model is : ',rnd_score)

print('.................................')

print('calculating the error')

# checking mean_squared error
MSE = mean_squared_error(ytest,y_predict)

# checking root mean squared error
RMSE = np.sqrt(MSE)

print('mean squared error is : ',MSE)

print('root mean squared error is : ',RMSE)

print(classification_report(ytest,x_predict))
输出:

与其他模型相比,RandomForestClassifier 的准确率为88% ,错误率也较低。该模型以 88% 的准确率预测白葡萄酒的质量。
值的预测:
比较预测值和我们的原始值以检查我们的模型是否预测了真实值:
蟒蛇3
# code
x_predict = list(rnd.predict(xtest))
df = {'predicted':x_predict,'orignal':ytest}
pd.DataFrame(df).head(10)
输出:
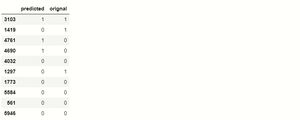
根据我们的输出,我们看到原始测试值与我们的 RandomForestClassifier 模型预测值非常相似。这里1代表质量大于0.7的被认为是优质葡萄酒,0代表低于0.7的质量不被认为是优质葡萄酒。