PyQtGraph - 调整绘图窗口的大小
在本文中,我们将看到如何在 PyQtGraph 模块中调整绘图窗口的大小。 PyQtGraph 是一个用于Python的图形和用户界面库,它提供了设计和科学应用程序中通常需要的功能。它的主要目标是提供用于显示数据(绘图、视频等)的快速交互式图形,其次是提供帮助快速应用程序开发的工具(例如,Qt Designer 中使用的属性树)。绘图窗口包括两个主要部分:包含实际绘制图形的绘图面板和控制面板。我们可以在setGeometry方法的帮助下设置窗口几何形状,但它也用于指定位置,尽管我们只能通过以编程方式调整窗口大小来设置或更改窗口的大小。
我们可以在下面给出的命令的帮助下创建一个绘图窗口
# creating a pyqtgraph plot window
window = pg.plot()
In order to do this we use resize method with the plot window object
Syntax : window.resize(width, height)
Argument : It takes two integer as argument
Return : It returns None
下面是实现
# importing pyqtgraph as pg
import pyqtgraph as pg
# importing QtCore and QtGui from the pyqtgraph module
from pyqtgraph.Qt import QtCore, QtGui
# importing numpy as np
import numpy as np
import time
# creating a pyqtgraph plot window
window = pg.plot()
# setting window geometry
# left = 100, top = 100
# width = 600, height = 500
window.setGeometry(100, 100, 600, 500)
# title
title = "GeeksforGeeks PyQtGraph"
# setting window title
window.setWindowTitle(title)
# create list for y-axis
y1 = [5, 5, 7, 10, 3, 8, 9, 1, 6, 2]
# create horizontal list i.e x-axis
x = [1, 2, 3, 4, 5, 6, 7, 8, 9, 10]
# create pyqt5graph bar graph item
# with width = 0.6
# with bar colors = green
bargraph1 = pg.BarGraphItem(x = x, height = y1, width = 0.6, brush ='g')
# add item to plot window
# adding bargraph item to the window
window.addItem(bargraph1)
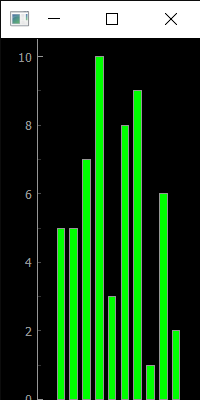
# resizing the plot window
window.resize(200, 400)
# main method
if __name__ == '__main__':
# importing system
import sys
# Start Qt event loop unless running in interactive mode or using
if (sys.flags.interactive != 1) or not hasattr(QtCore, 'PYQT_VERSION'):
QtGui.QApplication.instance().exec_()
输出 :