R 编程中的多态性
R 语言正在发展,它实现了参数多态性,这意味着 R 中的方法指的是函数,而不是类。参数多态性主要允许您为尚未定义且可能永远不会定义的对象类型定义通用方法或函数。这意味着可以为具有不同参数集和来自不同类的多个函数使用相同的名称。 R 的方法调用机制是泛型,它允许注册某些名称以在 R 中被视为方法,并且它们充当调度程序。
通用函数
R中的多态性可以通过泛型获得。它允许将某些名称视为方法,并且它们充当调度程序。让我们借助 plot()函数和 summary函数来理解。在 R 编程中, plot()和summary()函数根据传递给它们的对象返回不同的结果,这就是为什么它们是实现多态性的通用函数的原因。
R中的绘图()
plot()是在 R 中实现多态性的通用函数之一。如果给定向量、因子、数据框等,它会生成不同的图形。但是你有没有想过向量或因子的类是如何确定的用于绘图的方法?让我们看一下绘图函数的代码。
示例:绘图函数代码
R
plotR
help(UseMethod)R
methods(plot)R
# R program to illustrate
# polymorphosim

# X Window System Graphics (X11)
X11(width = 15, height = 13)

# The runif() function generates
# random deviates of the uniform distribution
x <- 3 * runif(40) + (1:30)
par(mar = c(20, 20, 1, 1))

# type='l' is used  to connect the points
# of the scatter plots with lines.
plot(x, type = 'l', col = '#343deb')

# We can do  mouse click or enter pressed
z <- locator(1)
R
# R program to illustrate
# polymorphosim

# X Window System Graphics (X11)
X11(width = 5, height = 3)

# The runif() function generates random
# deviates of the uniform distribution
x <- runif(20)
y <- runif(20) * x
par(mar = c(2, 2, 0.3, 0.3))

# type = 'p' means as points, the output comes as scattered
# pch stands for plot character. pch = 16 we get . character
plot(x, y, type = 'p', pch = 16, col = '#ab1ab0')

#Either mouse press or enter key press wait
z <- locator(1)
R
# R program to illustrate
# polymorphosim

# X Window System Graphics (X11)
X11(width = 5, height = 8)

# here fruits names are passed and barchart is produced as output
f <- factor(c('apple', 'orange', 'apple', 'pear', 'orange',
              'apple', 'apple', 'orange'))
par(mar = c(2, 2, 0.6, 0.6))

# Using plot()
plot(f, col = '#8f4c91')
z <- locator(1)
R
# R program to illustrate
# polymorphosim

# X Window System Graphics (X11)
X11(width = 6, height = 6)

set.seed(280870)
x <- c(4, 3, 1, 2, 2, 4, 6, 4, 5, 5,
       4, 4, 5, 4, 4, 8, 4, 1, 2, 7)
y <- x * rnorm(20, 1, 0.3)
z <- x * y

# Takina a data frame
df <- data.frame(x, y, z)
par(mar = c(0.1, 0.1, 0.1, 0.1))

# Using plot()
plot(df, col = '#a832a6', pch = 16, cex = 1.5)
z <- locator(1)
R
# R program to illustrate
# polymorphosim

# Rainbow colors and let us see summary of it
colors <- c("violet", "indigo", "blue", "green",
            "yellow", "orange", "red")
summary(colors)
R
# R program to illustrate
# polymorphosim

state.region

# Provides summarised results under each region
summary(state.region)

# As maxsum is given as 3, totally we should have 3 regions
# But here we have 4 regions and hence highest count region,
# next highest count region is displayed and the other
# regions are clubbed under Other
summary(state.region, maxsum = 3)
R
# R program to illustrate
# polymorphosim

# 10 different data sets are taken using stats::rnorm
x <- stats::rnorm(10)
x

# Let us cut the dataset to lie between -3 and 3 and
# in this case, it will be
# (-3,-2] (-2,-1] (-1,0] (0,1] (1,2] (2,3]
c <- cut(x, breaks = -3:3)
c

# Summarized the available dataset under the given levels
summary(c)
R
display <- function(obj){
    UseMethod("print")
}
R
print.bank<-function(obj)
{
    cat("Name is ", obj$name, "\n")
    cat(obj$account_no, " is the Acc no of the holder\n ")
    cat(obj$saving, " is the amount of saving in the account \n ")
    cat(obj$withdrawn, " is the withdrawn amount\n")
}
R
x <- list(name ="Arjun", account_no = 1234,
        saving = 1500, withdrawn = 234)
class(x)<-"bank"

display <- function(obj){
    UseMethod("print")
}

print.bank<-function(obj)
{
    cat("Name is ", obj$name, "\n")
    cat(obj$account_no, " is the Acc no of the holder\n ")
    cat(obj$saving, " is the amount of saving in the account \n ")
    cat(obj$withdrawn, " is the withdrawn amount\n")
}

display(x)
输出:
function (x, y, ...)
UseMethod("plot")
我们可以看到 plot函数的主体只包含一个表达式,那就是 UseMethod(“plot”)。让我们在 help()函数的帮助下查看 UseMethod 的定义。
示例: help() 方法的定义。
R
help(UseMethod)
输出:

从上面的输出中,我们可以看到 UseMethod 有两个参数 generic 和 object。
- 泛型是字符串名称,它是函数的名称(在本例中为绘图)。
- 这是一个对象,其类将确定将被“分派”的方法,它表示将为其调用泛型方法的对象。
然后,UseMethod 通过创建 plot.object 类型的字符串来搜索需要调用的合适绘图函数。我们还可以看到 plot函数的所有可用方法。
例子:
R
methods(plot)
输出:
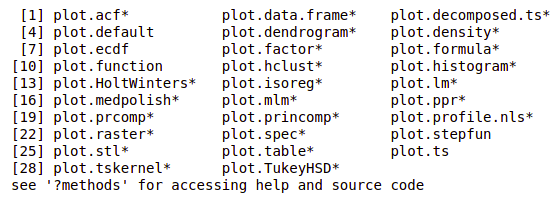
让我们看看plot()函数如何接受参数并显示不同的输出
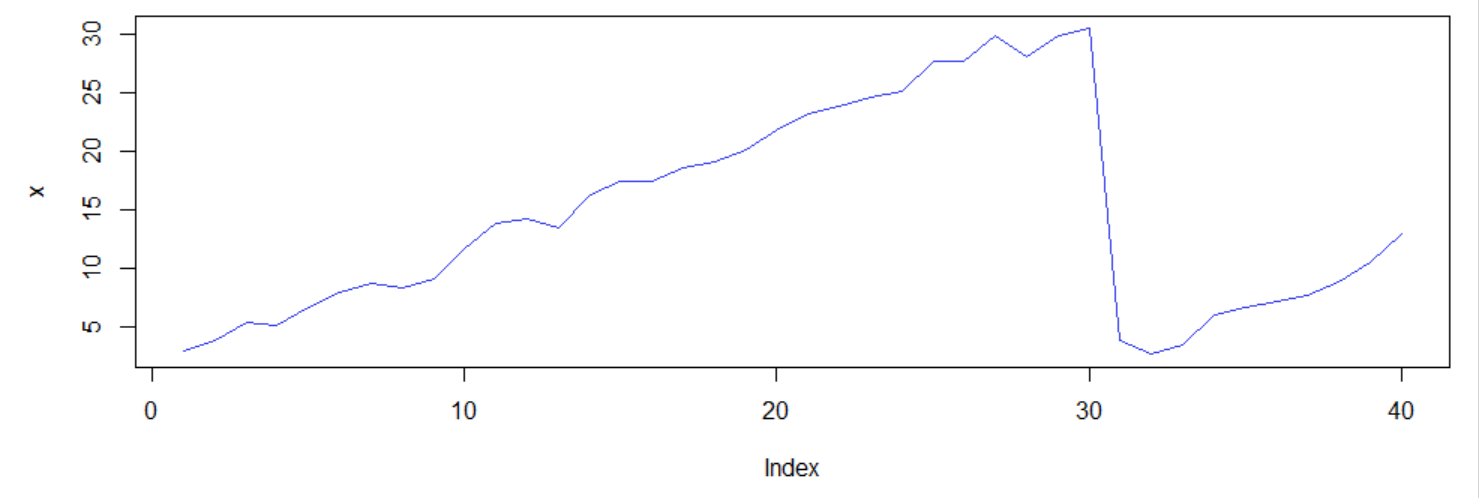
输入是一个数值向量
在此示例中,让我们将plot()函数中的单个数字向量作为参数。
R
# R program to illustrate
# polymorphosim

# X Window System Graphics (X11)
X11(width = 15, height = 13)

# The runif() function generates
# random deviates of the uniform distribution
x <- 3 * runif(40) + (1:30)
par(mar = c(20, 20, 1, 1))

# type='l' is used  to connect the points
# of the scatter plots with lines.
plot(x, type = 'l', col = '#343deb')

# We can do  mouse click or enter pressed
z <- locator(1)
输出:
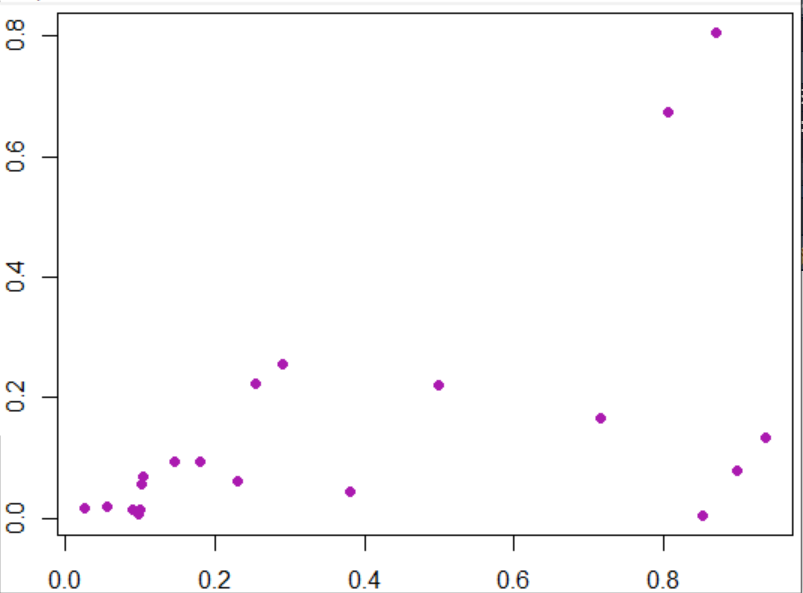
输入是两个数值向量
我们需要传递两个向量参数,它会相应地生成一个散点图。
R
# R program to illustrate
# polymorphosim

# X Window System Graphics (X11)
X11(width = 5, height = 3)

# The runif() function generates random
# deviates of the uniform distribution
x <- runif(20)
y <- runif(20) * x
par(mar = c(2, 2, 0.3, 0.3))

# type = 'p' means as points, the output comes as scattered
# pch stands for plot character. pch = 16 we get . character
plot(x, y, type = 'p', pch = 16, col = '#ab1ab0')

#Either mouse press or enter key press wait
z <- locator(1)
输出:
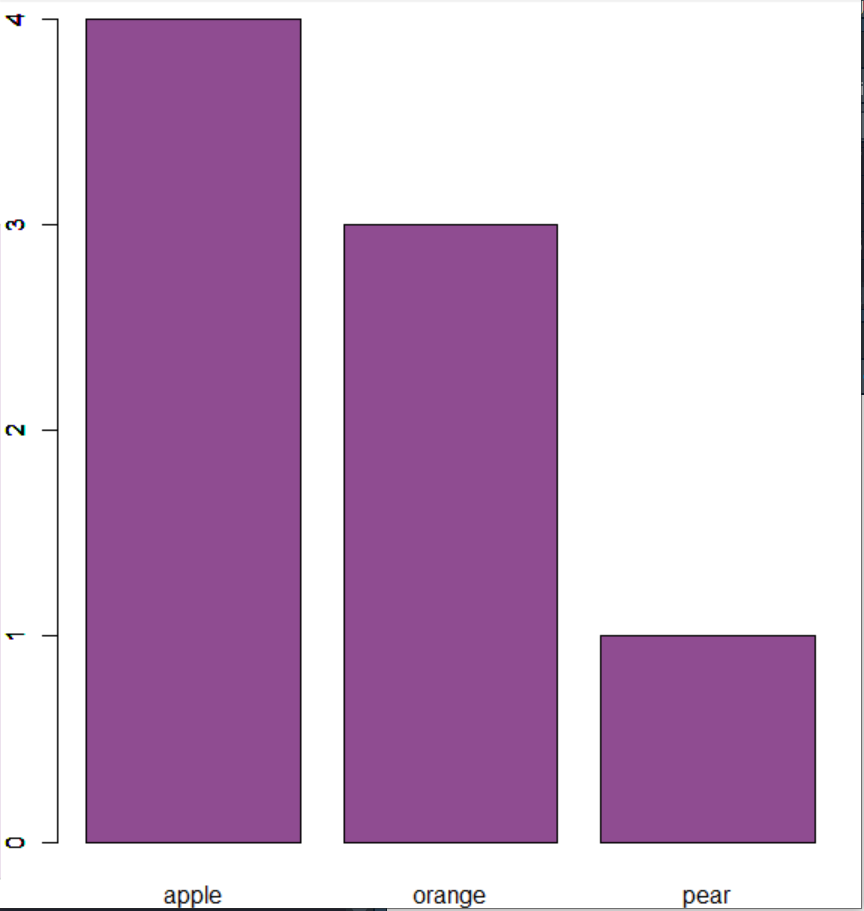
输入是一个因素
要是我们 将因子作为参数传递,然后我们得到一个条形图模式。
R
# R program to illustrate
# polymorphosim

# X Window System Graphics (X11)
X11(width = 5, height = 8)

# here fruits names are passed and barchart is produced as output
f <- factor(c('apple', 'orange', 'apple', 'pear', 'orange',
              'apple', 'apple', 'orange'))
par(mar = c(2, 2, 0.6, 0.6))

# Using plot()
plot(f, col = '#8f4c91')
z <- locator(1)
输出:
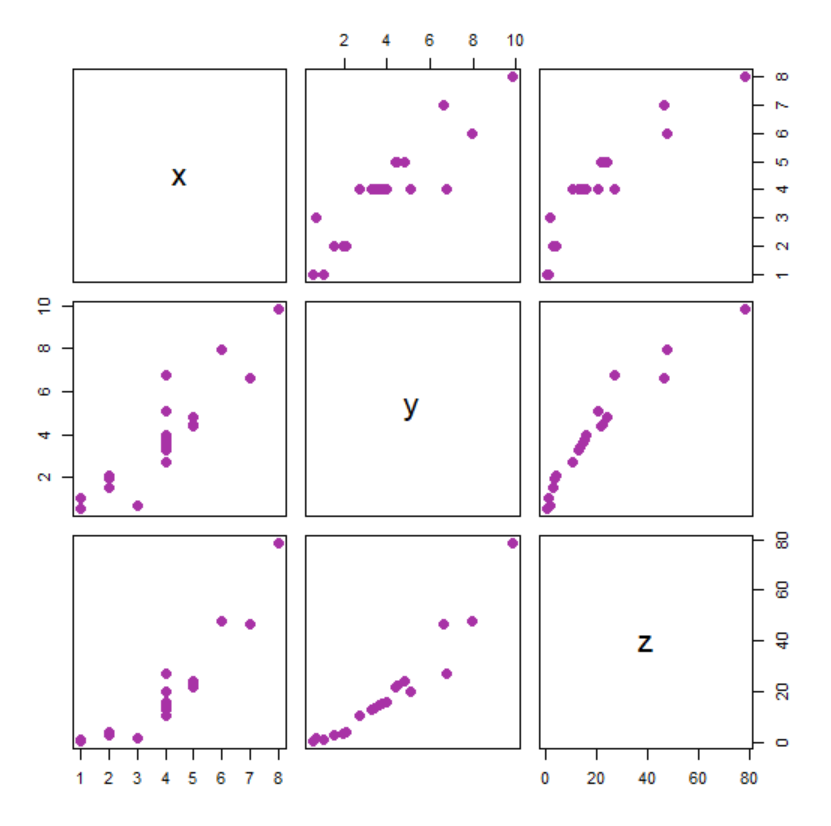
输入是一个数据框
Plot函数将数据框作为参数,并将数据框的每个变量相互绘制。
R
# R program to illustrate
# polymorphosim

# X Window System Graphics (X11)
X11(width = 6, height = 6)

set.seed(280870)
x <- c(4, 3, 1, 2, 2, 4, 6, 4, 5, 5,
       4, 4, 5, 4, 4, 8, 4, 1, 2, 7)
y <- x * rnorm(20, 1, 0.3)
z <- x * y

# Takina a data frame
df <- data.frame(x, y, z)
par(mar = c(0.1, 0.1, 0.1, 0.1))

# Using plot()
plot(df, col = '#a832a6', pch = 16, cex = 1.5)
z <- locator(1)
输出:
R中的摘要()
它也是R中实现多态性的通用函数。它用于生成各种模型拟合函数结果的结果摘要。
示例 1:
R
# R program to illustrate
# polymorphosim

# Rainbow colors and let us see summary of it
colors <- c("violet", "indigo", "blue", "green",
            "yellow", "orange", "red")
summary(colors)
输出:
Length     Class      Mode
  7      character character
示例 2:
让我们检查一下 state.region 的汇总结果。在 R 中,它通常显示“Northeast”、“South”、“North Central”和“West”下可用的区域。使用summary()函数可以将 state.region 作为第一个参数传递,作为第二步,(可选)传递“maxsum”参数。 “maxsum”表示应该为输出中的因子显示多少个级别。
R
# R program to illustrate
# polymorphosim

state.region

# Provides summarised results under each region
summary(state.region)

# As maxsum is given as 3, totally we should have 3 regions
# But here we have 4 regions and hence highest count region,
# next highest count region is displayed and the other
# regions are clubbed under Other
summary(state.region, maxsum = 3)
输出:
> state.region
 [1] South         West          West          South         West          West
 [7] Northeast     South         South         South         West          West
[13] North Central North Central North Central North Central South         South
[19] Northeast     South         Northeast     North Central North Central South
[25] North Central West          North Central West          Northeast     Northeast
[31] West          Northeast     South         North Central North Central South
[37] West          Northeast     Northeast     South         North Central South
[43] South         West          Northeast     South         West          South
[49] North Central West
Levels: Northeast South North Central West

> summary(state.region)
    Northeast         South North Central          West
            9            16            12            13

> summary(state.region, maxsum = 3)
  South    West (Other)
     16      13      21
示例 3:
如果数据集非常大,那么让我们看看summary()函数是如何工作的。
R
# R program to illustrate
# polymorphosim

# 10 different data sets are taken using stats::rnorm
x <- stats::rnorm(10)
x

# Let us cut the dataset to lie between -3 and 3 and
# in this case, it will be
# (-3,-2] (-2,-1] (-1,0] (0,1] (1,2] (2,3]
c <- cut(x, breaks = -3:3)
c

# Summarized the available dataset under the given levels
summary(c)
输出:
> x
 [1]  0.66647846 -0.29140286 -0.29596477 -0.23432541 -0.02144178  1.56640107  0.64575227
 [8] -0.23759734  0.73304657 -0.04201218

> c
 [1] (0,1]  (-1,0] (-1,0] (-1,0] (-1,0] (1,2]  (0,1]  (-1,0] (0,1]  (-1,0]
Levels: (-3,-2] (-2,-1] (-1,0] (0,1] (1,2] (2,3]

> summary(c)
(-3,-2] (-2,-1]  (-1,0]   (0,1]   (1,2]   (2,3]
0 0 6 3 1 0 到目前为止,我们已经描述了plot()和summary()函数,它们是一个多态函数。通过不同的输入, plot()函数的行为正在改变并产生输出。这里我们可以看到多态的概念。同样,在summary() 、 函数中,通过改变参数,同样的方法适用于提供不同的统计输出。现在让我们创建自己的泛型方法。
创建通用方法
让我们创建一个类库,并尝试创建我们自己的display()方法,该方法将使用 print() 方法并以我们指定的格式显示类的内容。
为此,我们首先必须创建一个将使用 UseMethod函数。
R
display <- function(obj){
    UseMethod("print")
}
创建通用显示函数后,让我们为类库创建显示函数。
R
print.bank<-function(obj)
{
    cat("Name is ", obj$name, "\n")
    cat(obj$account_no, " is the Acc no of the holder\n ")
    cat(obj$saving, " is the amount of saving in the account \n ")
    cat(obj$withdrawn, " is the withdrawn amount\n")
}
现在,让我们看看这个函数给出的输出
R
x <- list(name ="Arjun", account_no = 1234,
        saving = 1500, withdrawn = 234)
class(x)<-"bank"

display <- function(obj){
    UseMethod("print")
}

print.bank<-function(obj)
{
    cat("Name is ", obj$name, "\n")
    cat(obj$account_no, " is the Acc no of the holder\n ")
    cat(obj$saving, " is the amount of saving in the account \n ")
    cat(obj$withdrawn, " is the withdrawn amount\n")
}

display(x)
输出:
Name is  Arjun
1234  is the Acc no of the holder
 1500  is the amount of saving in the account
 234  is the withdrawn amount