Python中的 TextTable 模块
它是一个Python模块,可以帮助我们在终端上打印表格。它是用于以 ASCII 代码读取和写入文本表的基本Python模块之一。它旨在使界面尽可能类似于Python中的csv模块。 texttable模块支持固定大小的表(列大小是预先确定的)和动态大小的表(可以添加或删除列)。
安装:
pip install texttable
循序渐进的方法:
- 导入所需的模块。
Python3
# Import required module
import texttable
Python3
# Creating object
tableObj = texttable.Texttable(self,max width)

# max_width must be an integer,whose value is maximum width of the table
# if set to 0, size is unlimited (self adjustible according to text inside cell),
# therefore cells won't be wrapped so it's recommended to use 0
Python3
# Creating columns
tableObj.set_cols_align(["l", "l", "r", "c"])

# Set the desired columns alignment:
# "l" refers to column flushed left
# "c" refers to  column centered
# "r" refers to column flushed right
Python3
# Set datatype
tableObj.set_cols_dtype(["t", "i", "f", "a"])

# texttable objects supports five types of data types:
# "t" refers to text
# "f" refers to decimal
# "e" refers to exponent
# "i" refers to integer
# "a" refers to automatic
Python3
# Adjust Columns
tableObj.set_cols_valign(["t", "t", "m", "b"])

# Set the desired columns vertical alignment the elements of the
# array should be either "t", "m" or "b":
# "t" refers to column aligned on the top of the cell
# "m" refers to column aligned on the middle of the cell
# "b" refers to column aligned on the bottom of the cell
Python3
# Adding rows
table.add_rows([
        ["Text_Heading", "Int_Heading", "Float_Heading", "Auto_Heading"],
        ["Data1", 9, 1.23456789, "GFG"],
        ["Data2", 1, 9.87654321, "g4g"],
        ])

# add_rows(self, rows, header=True):
# The 'rows' argument can be either an iterator returning arrays, or a
# by-dimensional array.
# 'header' specifies if the first row should be used as the header of the table
Python3
print(tableObj.draw())Python3
# Import required module
import texttable
# Create texttable object
tableObj = texttable.Texttable()
# Set columns
tableObj.set_cols_align(["l", "r", "c"])
# Set datatype of each column
tableObj.set_cols_dtype(["a", "i", "t"])
# Adjust columns
tableObj.set_cols_valign(["t", "m", "b"])
# Insert rows
tableObj.add_rows([
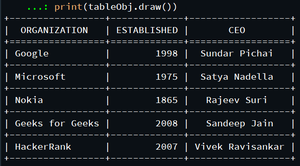
["ORGANIZATION", "ESTABLISHED", "CEO"],
["Google", 1998, "Sundar Pichai"],
["Microsoft", 1975, "Satya Nadella"],
["Nokia", 1865, "Rajeev Suri"],
["Geeks for Geeks", 2008, "Sandeep Jain"],
["HackerRank", 2007, "Vivek Ravisankar"]
])
# Display table
print(tableObj.draw())- 创建一个texttable()对象
蟒蛇3
# Creating object
tableObj = texttable.Texttable(self,max width)

# max_width must be an integer,whose value is maximum width of the table
# if set to 0, size is unlimited (self adjustible according to text inside cell),
# therefore cells won't be wrapped so it's recommended to use 0
- 使用set_cols_align()方法 创建列。
蟒蛇3
# Creating columns
tableObj.set_cols_align(["l", "l", "r", "c"])

# Set the desired columns alignment:
# "l" refers to column flushed left
# "c" refers to  column centered
# "r" refers to column flushed right
- 使用set_cols_dtype()设置每列的数据类型。但是,此步骤是可选的。
蟒蛇3
# Set datatype
tableObj.set_cols_dtype(["t", "i", "f", "a"])

# texttable objects supports five types of data types:
# "t" refers to text
# "f" refers to decimal
# "e" refers to exponent
# "i" refers to integer
# "a" refers to automatic
- 使用set_cols_valign()调整列。
蟒蛇3
# Adjust Columns
tableObj.set_cols_valign(["t", "t", "m", "b"])

# Set the desired columns vertical alignment the elements of the
# array should be either "t", "m" or "b":
# "t" refers to column aligned on the top of the cell
# "m" refers to column aligned on the middle of the cell
# "b" refers to column aligned on the bottom of the cell
- 使用add_rows()方法向表中插入行
蟒蛇3
# Adding rows
table.add_rows([
        ["Text_Heading", "Int_Heading", "Float_Heading", "Auto_Heading"],
        ["Data1", 9, 1.23456789, "GFG"],
        ["Data2", 1, 9.87654321, "g4g"],
        ])

# add_rows(self, rows, header=True):
# The 'rows' argument can be either an iterator returning arrays, or a
# by-dimensional array.
# 'header' specifies if the first row should be used as the header of the table
- 使用draw()方法来显示表格。
蟒蛇3
print(tableObj.draw())
表格插图将是这样的:

以下是基于上述方法的程序:
蟒蛇3
# Import required module
import texttable

# Create texttable object
tableObj = texttable.Texttable()

# Set columns
tableObj.set_cols_align(["l", "r", "c"])

# Set datatype of each column
tableObj.set_cols_dtype(["a", "i", "t"])

# Adjust columns
tableObj.set_cols_valign(["t", "m", "b"])

# Insert rows
tableObj.add_rows([
        ["ORGANIZATION", "ESTABLISHED", "CEO"],
        ["Google", 1998, "Sundar Pichai"],
        ["Microsoft", 1975, "Satya Nadella"],
        ["Nokia", 1865, "Rajeev Suri"],
        ["Geeks for Geeks", 2008, "Sandeep Jain"],
        ["HackerRank", 2007, "Vivek Ravisankar"]
        ])

# Display table
print(tableObj.draw())
输出: